Why online reputation management matters for SEO Before customers buy from you, they Google you....
Online reviews aren’t just digital noise—they’re the pulse of your reputation. Whether it’s Google, Facebook,...
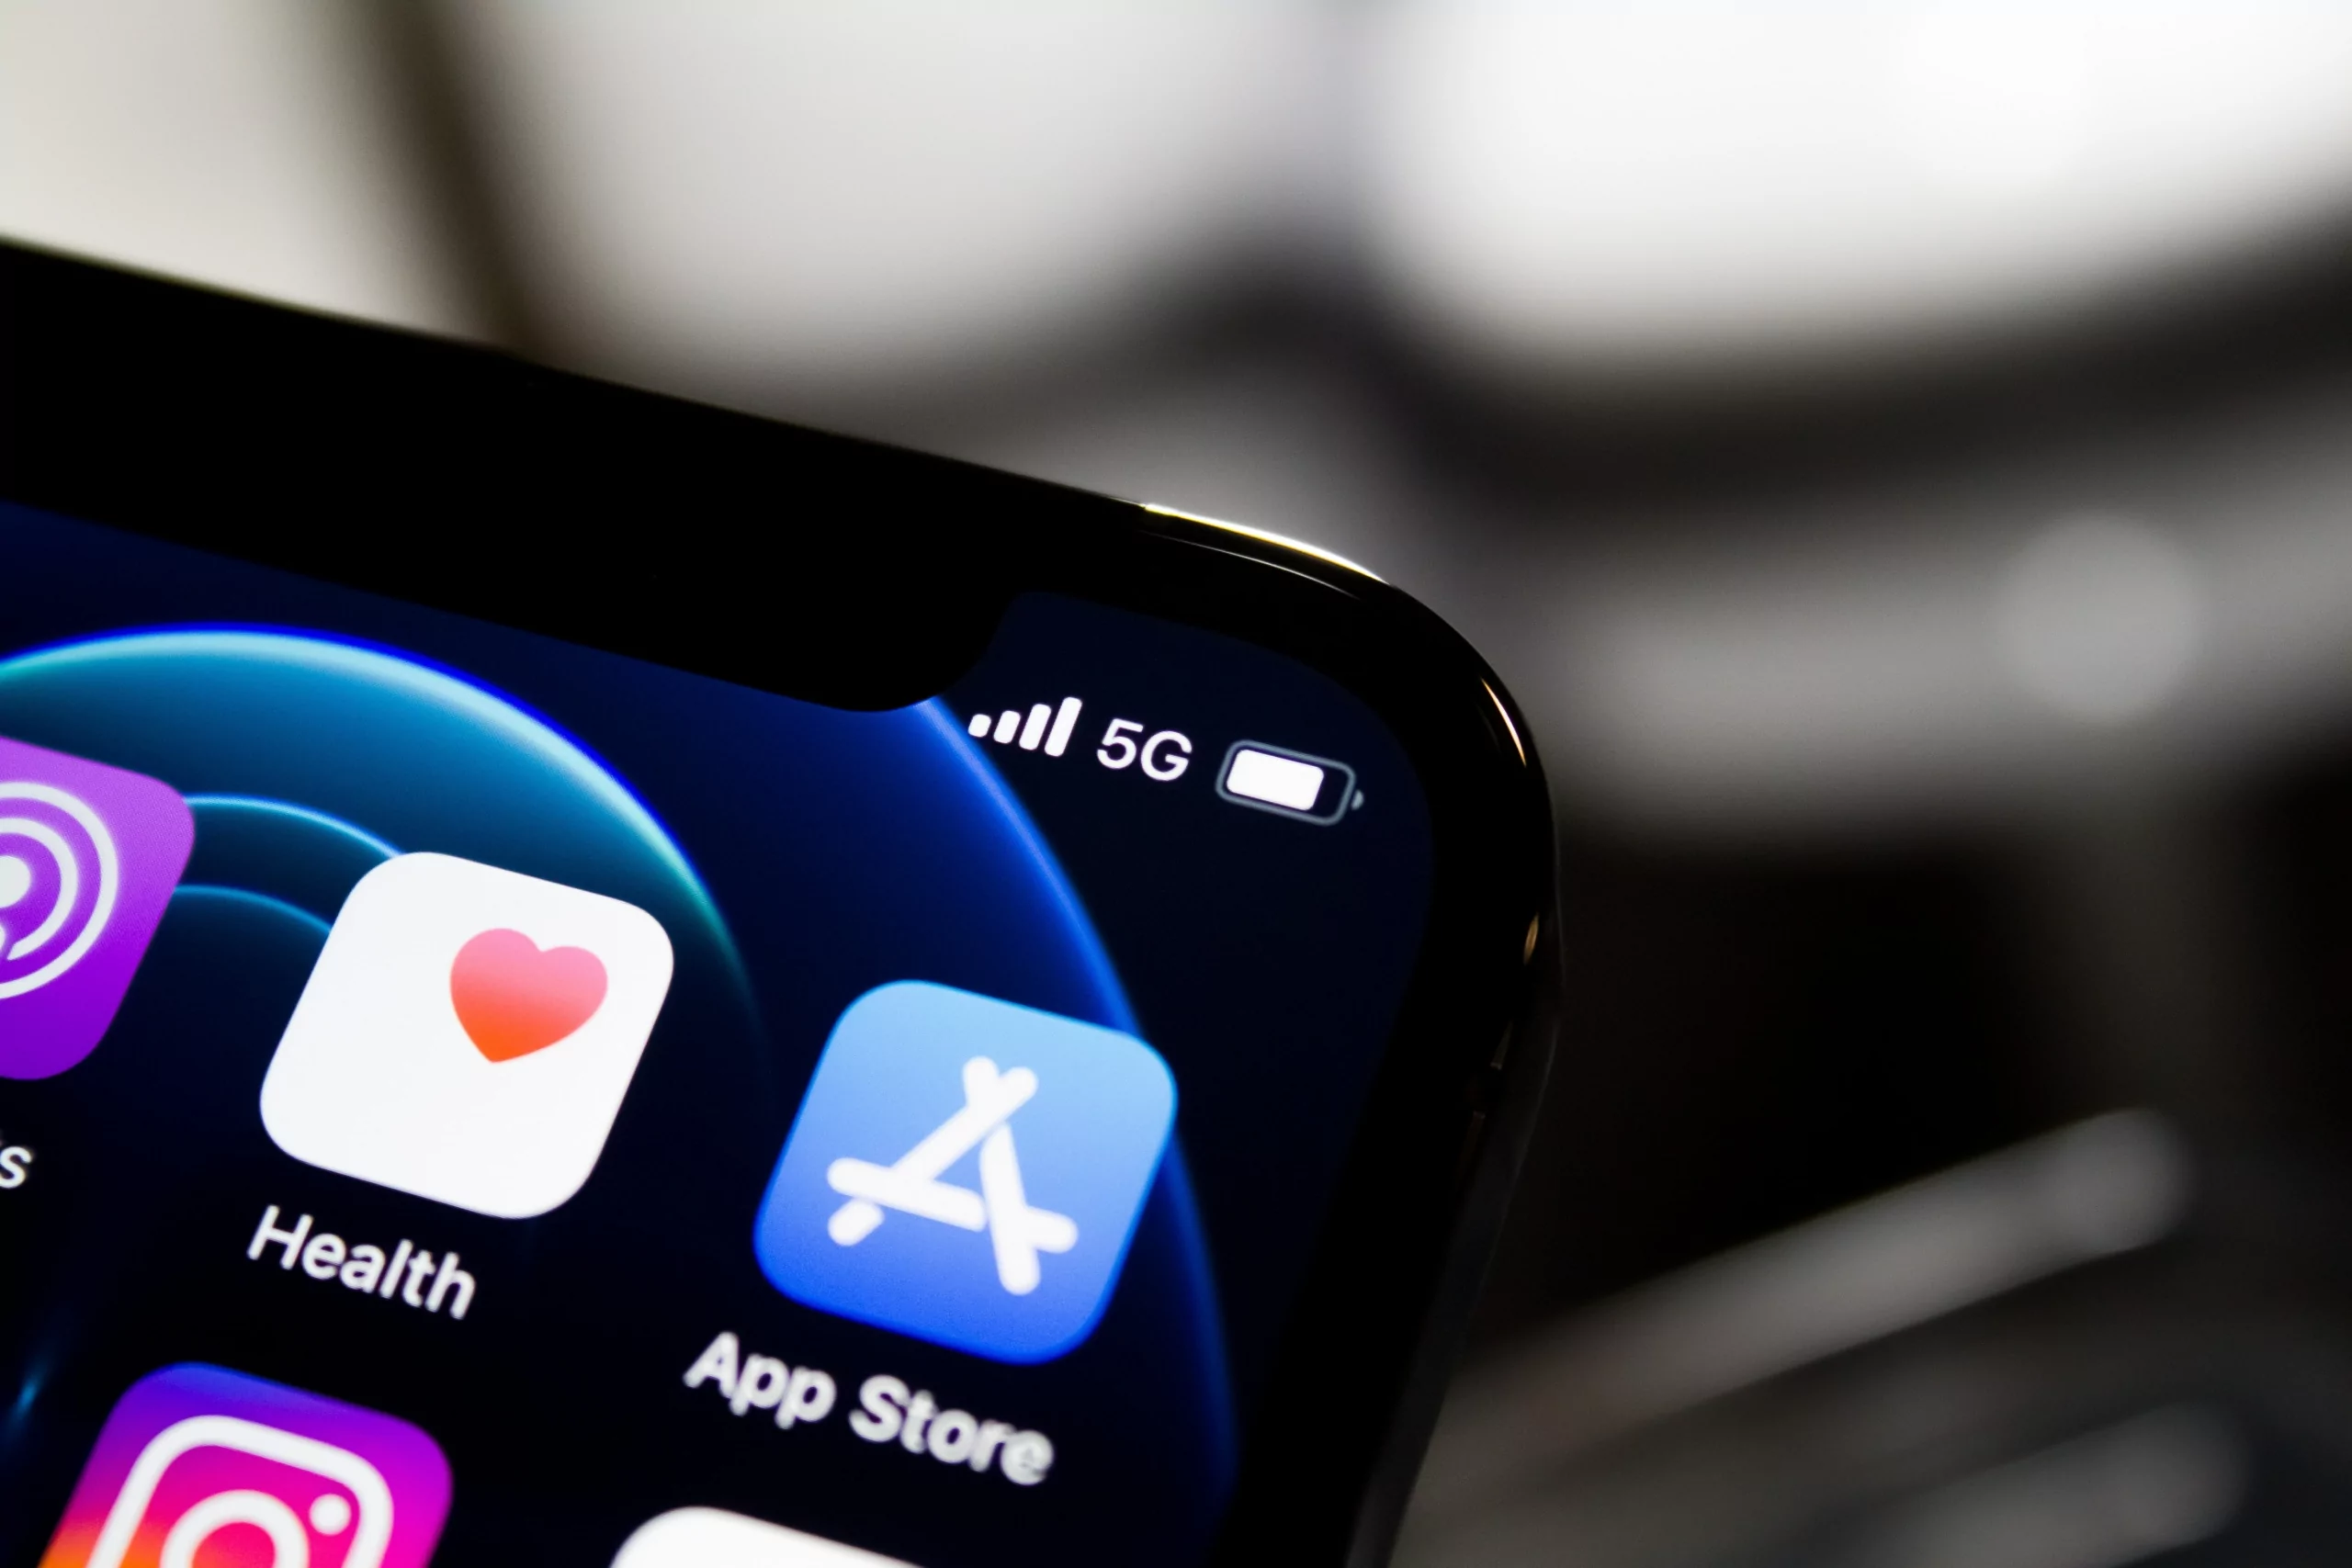
While app-store ratings and reviews aren’t the only indicator of a successful app, the opportunity...
Over the past few years, many people in the development community have sounded off about...
Positive reviews tell you what people like about your app and what you are doing...
For many customers, their first interaction with a brand happens on a mobile device, so...
Your customers are already on their phones – meet them where they’re at through in-app...
When it comes to App Store Optimization (ASO), most brands think about keywords, compelling copy,...
It all starts with a simple question: “Do you love our app?” This phrase has...
App ratings and reviews are important metrics to understand when determining what drives customer acquisition....
The following data and information on Shopping apps is from our 2022 Mobile App Customer...
The following data and information on Travel apps is from our 2022 Mobile App Customer...
The following data and information is from our 2022 Mobile App Customer Engagement Report. Subcategories...
Healthcare App Subcategories: Medical, Fitness, Health Insurance In our 2022 Mobile Customer Engagement Benchmark Report,...
Subcategories: Restaurant, Food Services In our 2022 Mobile Customer Engagement Benchmark Report, a study of...
“Customer engagement is the ongoing interactions between company and customer, offered by the company, chosen...
Marketers are familiar with the traditional marketing funnel and the tactics that align with each...
On the last Tuesday of every month, our team gives some tough love to our...
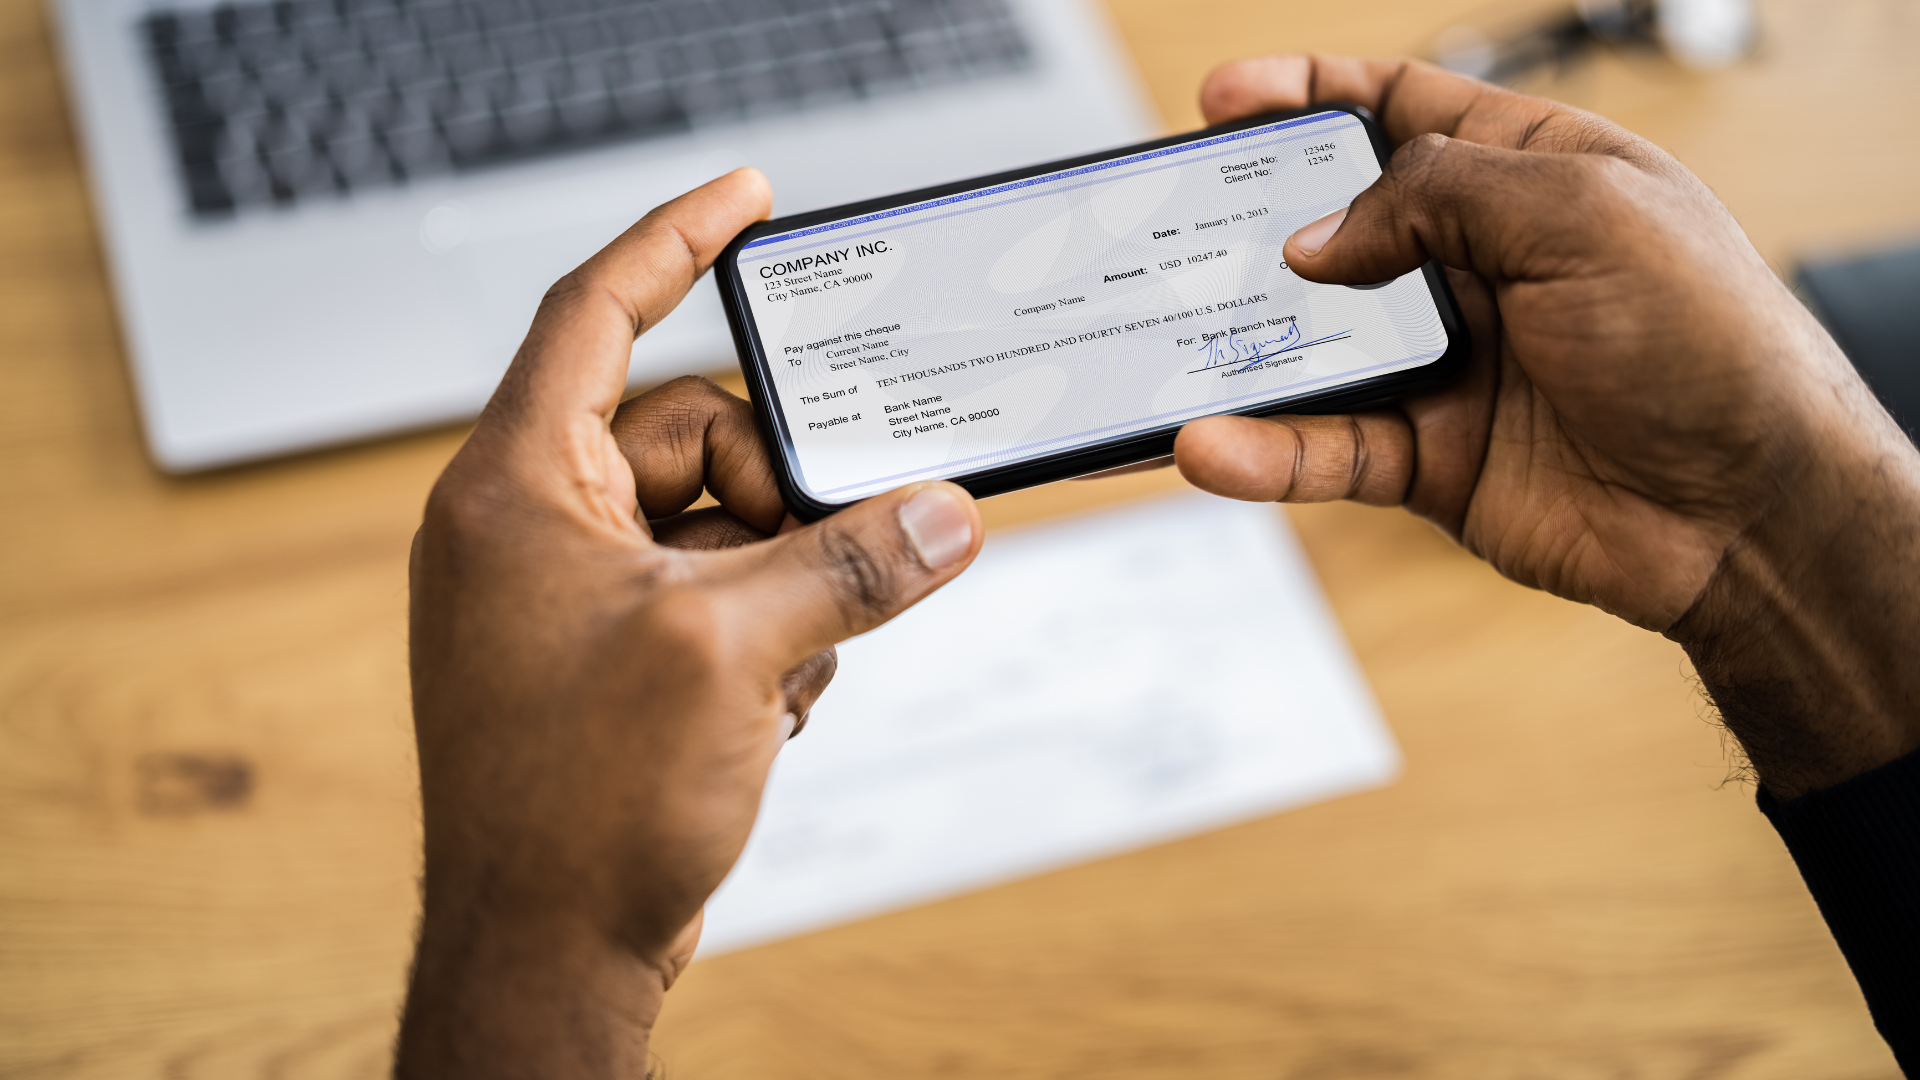
Banking, fintech, and insurance companies are uniquely positioned to build relationships with mobile consumers—but few...
One size did not fit all for Utilities apps in 2020. Depending on industry (energy,...
By accessing and using this page, you agree to the Terms of Use . Your information will never be shared.