The following data and information is from our 2022 Mobile App Customer Engagement Report.
Subcategories for Finance Apps: Fintech, Banking, Insurance
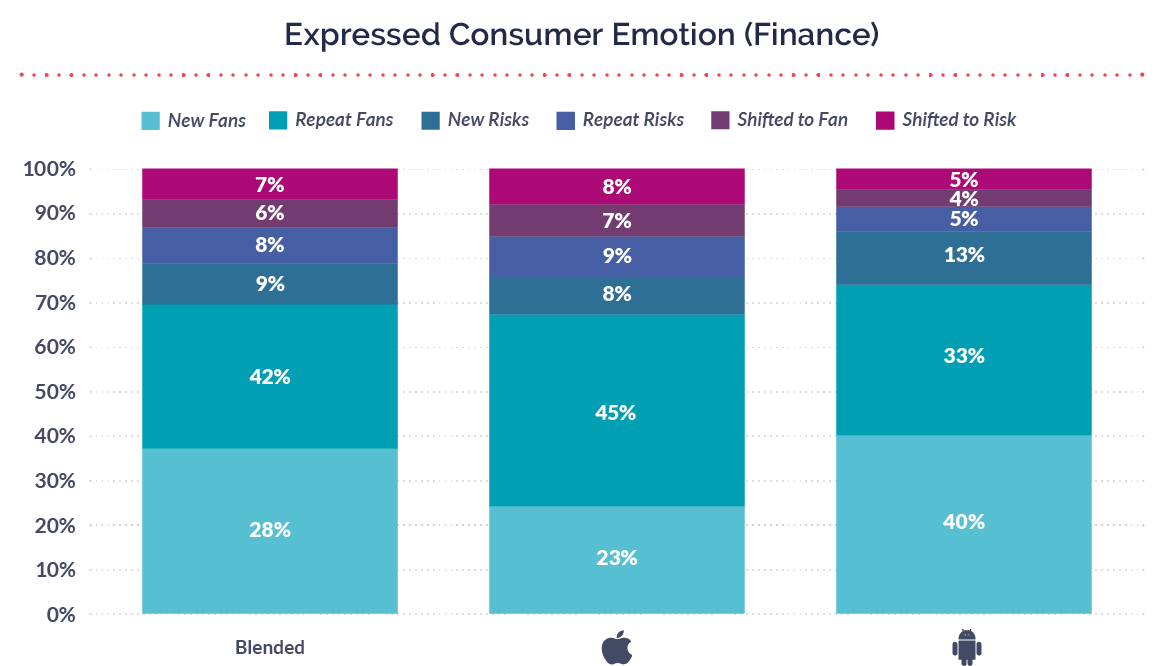
Finance apps experienced another year of customer engagement gains as people became more comfortable with managing their finances through apps. Below is a summary of how Finance apps fared over the course of 2021.
“Why do people like mobile banking? Something like an ATM is unlikely to annoy you, but not likely to delight you. A branch visit is unlikely to particularly delight or annoy, although it can do. A mobile app sits best in that delightful and not annoying box,” Paul Barnes, Northern Europe and Middle East Territory Director, data.ai
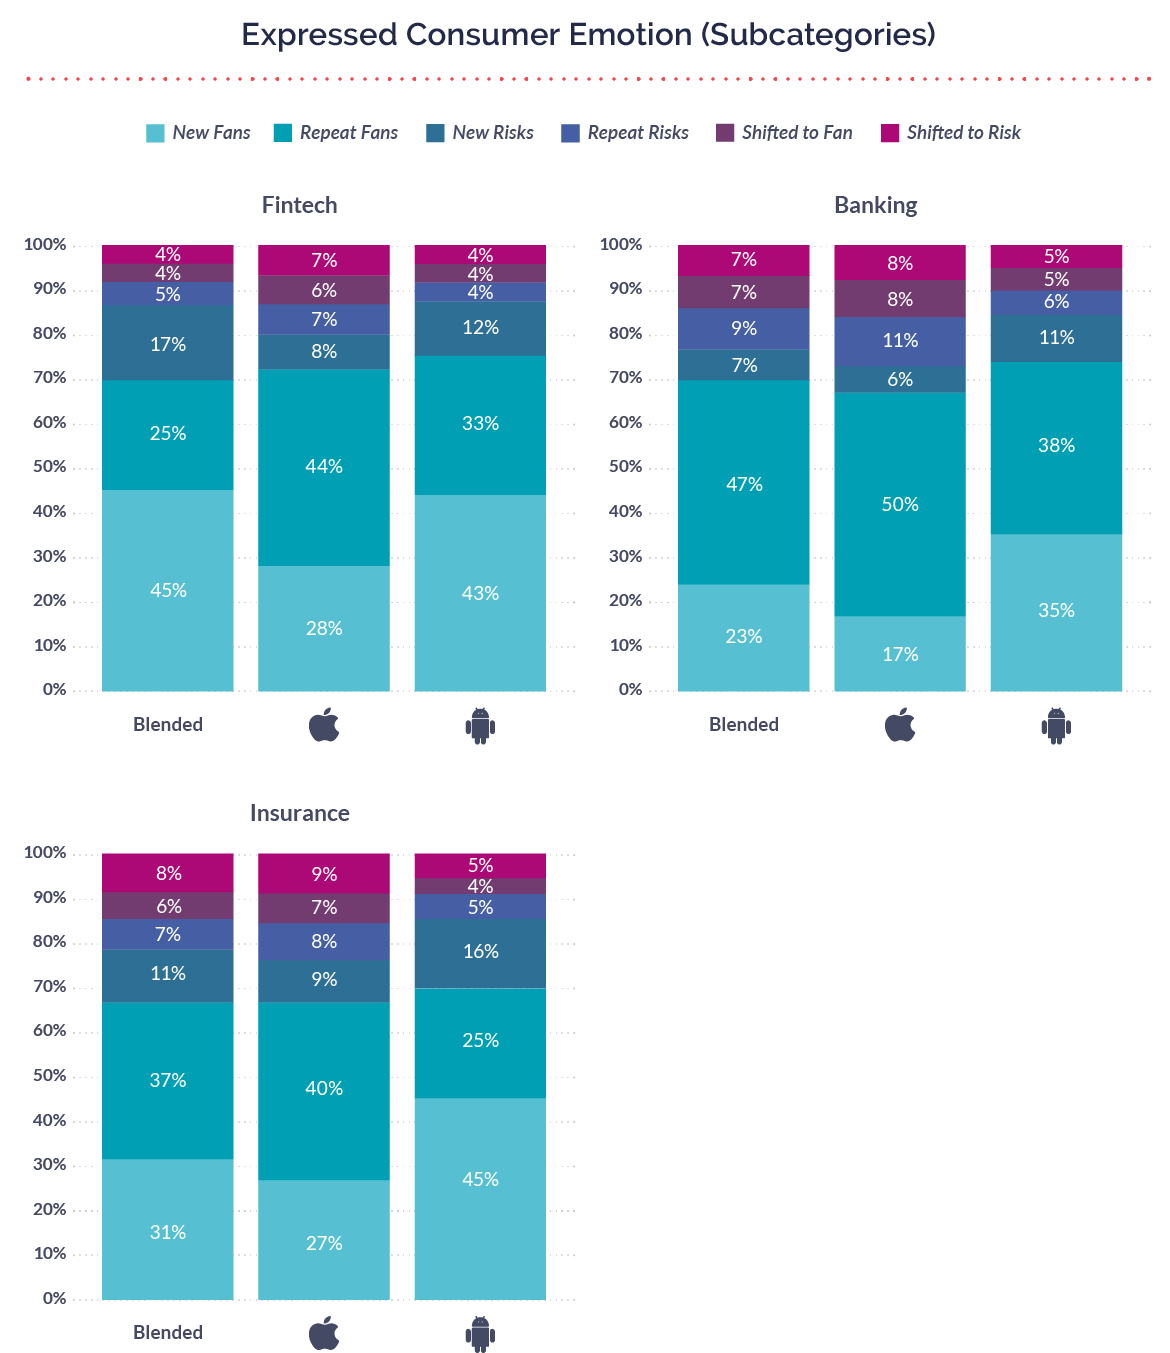
The Finance apps from our research are separated in three subcategories: Fintech (credit score, mortgage, stocks and bonds, loan consolidation, etc.), Banking (banks and credit unions), and Insurance (auto, home, life, renters, pets, etc.). Consumers in each subcategory have vastly different motivations and usage patterns, which we see represented in the data.

Data included:
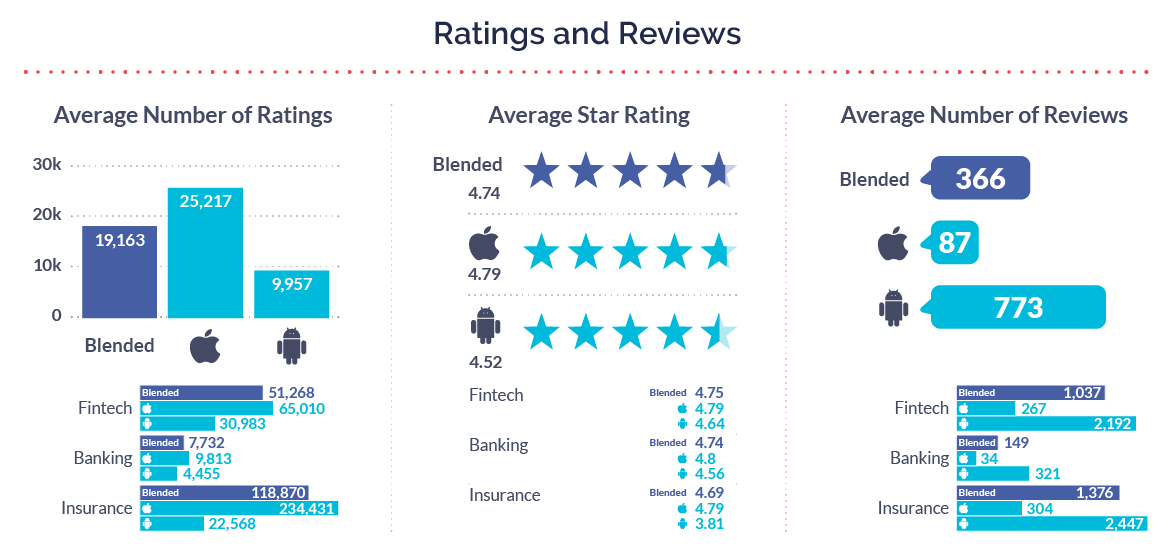
- Ratings and reviews
- Retention
- Interaction and response rates
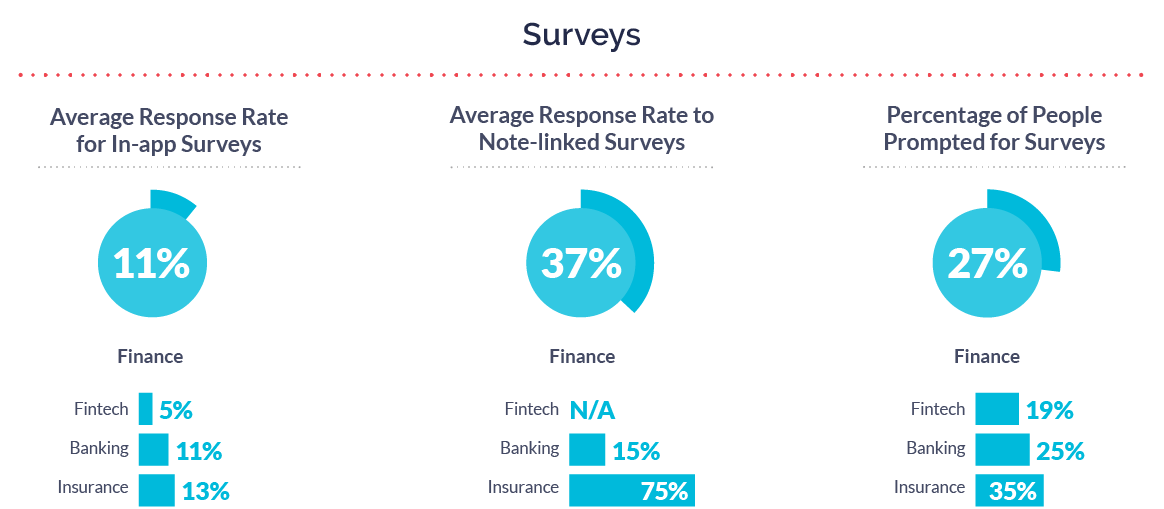
- Surveys
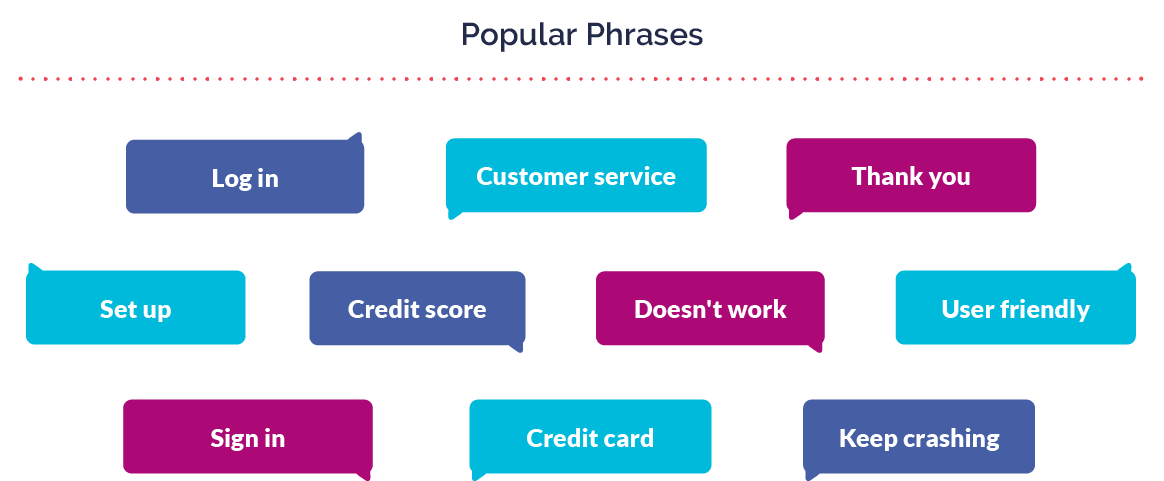
- Popular phrases
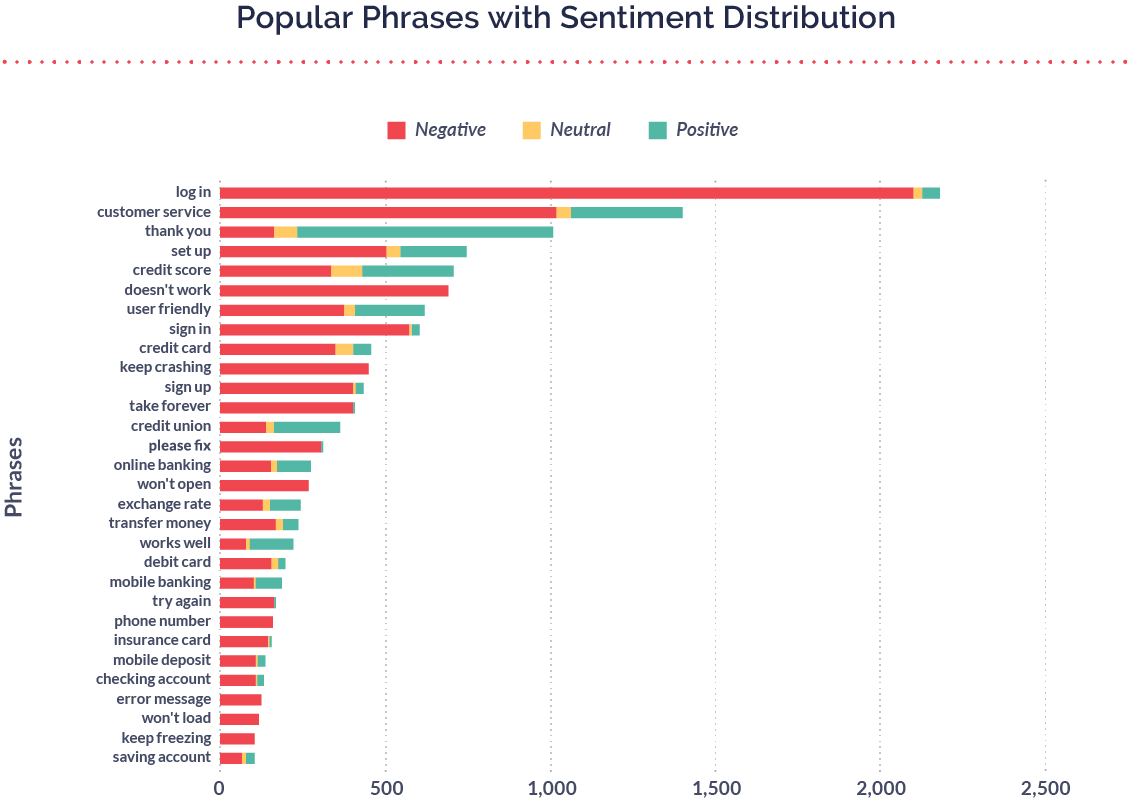
- Popular phrases with sentiment distribution
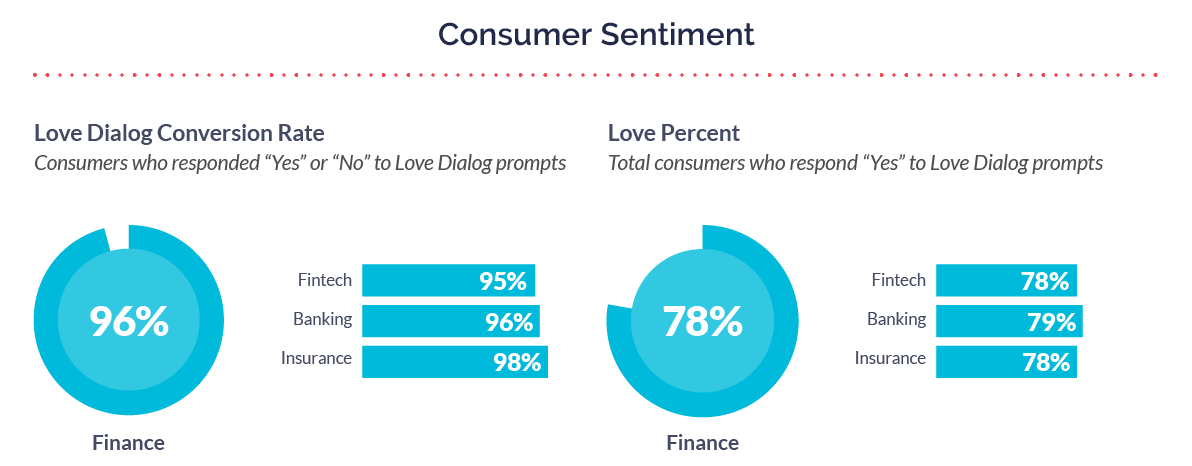
- Consumer sentiment
- Expressed customer emotion
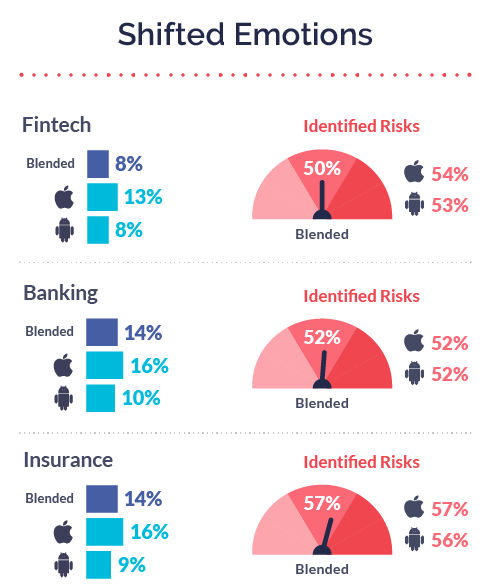
- Shifted emotions
- Expressed consumer sentiment by subcategory
- Shifted emotions by subcategory
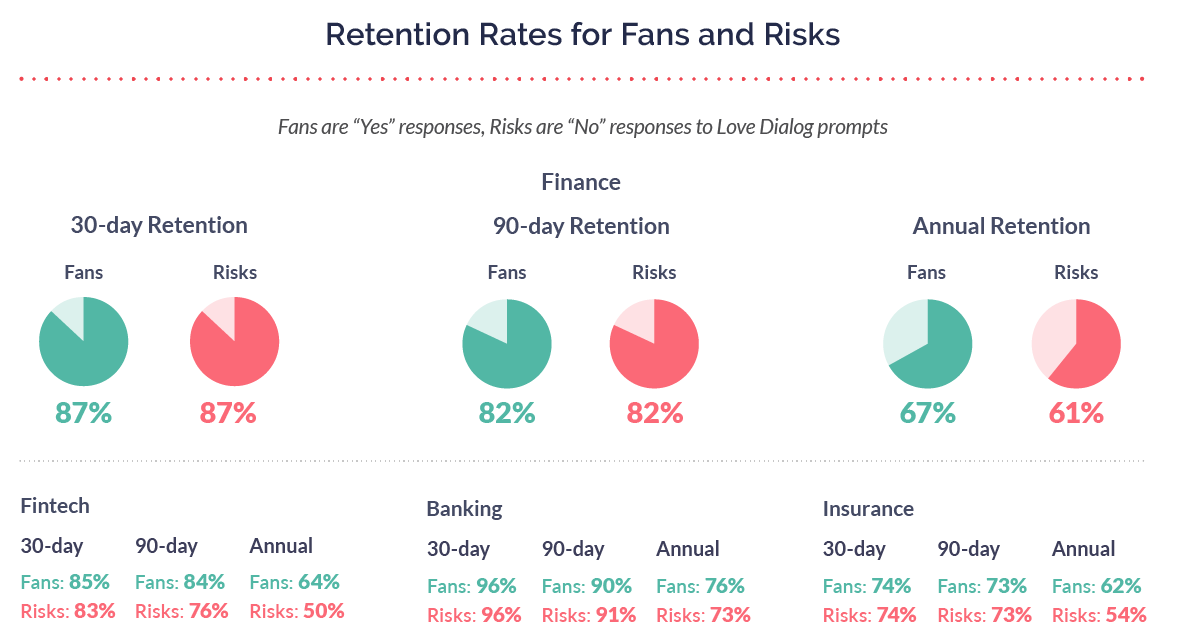
- Retention rates for Fans and Risks
→DOWNLOAD THE FULL 2022 BENCHMARK REPORT HERE
Summary of Finance Apps in 2021
Mobile teams prioritized proactively communicating with their consumers in 2021. Finance app average interaction rates were all above the overall average (26%) at 28% for Fintech, 43% for Banking, and 54% for Insurance. And consumers were eager to share their feedback. Response rates were phenomenal, with 94% for Fintech, a whopping 98% for Banking, and a high 97% for Insurance (91% overall). As a result, Love Percent improved for all subcategories, averaging 78% for Fintech and Insurance, and 79% for Banking (64% overall).
Finance apps typically have high retention rates, which held true in 2021. Collectively, the category had 30-day retention of 73% (67% overall), 90-day retention of 65% (58% overall), and annual retention of 48% (44% overall). It’s likely that Finance apps see lower churn than other categories due to the simple fact that it’s harder for people to change banks and shift their financial planning tools than it is to, say, try a new restaurant. But retention is the best indicator of consumer happiness, which is driven by teams who collect and act on their feedback. When engaged with a Love Dialog, 90-day retention grew to 81% in Fintech, 78% in Insurance, and 90% in Banking—said another way, almost all Banking consumers were retained for three months after they engaged with a Love Dialog.
A unique data point for Finance apps comes from looking at retention by segmenting emotional shifts between Fans versus Risks—particularly around improved retention for Risks. When Finance brands segmented interactions based on shifted emotions, their 30-day retention for both Fans and Risks increased to 87%; 90-day retention for both Fans and Risks increased to 82%; and annual retention for Fans increased to 67% and to 61% for Risks. This is notable because despite negative emotions at some point throughout the year, retention for Risks remained high. Understanding shifts in emotion and proactively engaging with consumers to get ahead of churn is a big opportunity for Finance brands in 2022 and beyond.
Bonus reading and resources
- 5 Mobile Customer Feedback Strategies for Finance Apps
- How Advantis Credit Union Uses In-App Mobile Surveys to Drive Product Roadmap and Improve App Ratings
- Q&A with Digital Transformation Experts: Igal Stolpner from Investing.com
- How to Boost Consumer Happiness in Your Finance App
- How FinTech Brands Can Use Sentiment Data to Improve CX
Want to see how the Finance category compares to the macro trends we identified in our 2022 Mobile Customer Engagement Report? Download your copy here.
Additional benchmarks for Finance apps
