
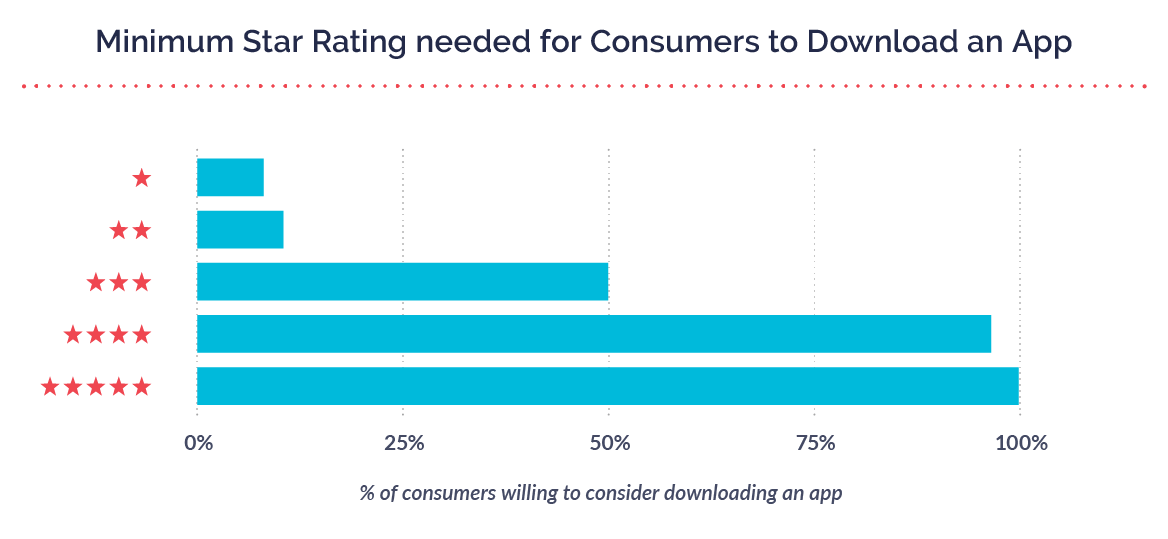
App ratings and reviews are important metrics to understand when determining what drives customer acquisition. The lower the star rating, the less likely they are to download the app.
The opportunity cost of moving up a star or going down a star is tremendous. Just moving from a three star app to a four can lead to an 89% increase in conversion.
Although ratings and reviews universally hold value, the competitive landscapes for iOS and Android apps are vastly different. Mobile app ratings and reviews strategies differ depending on which app store you’re competing in.
To identify and learn about these differences, we looked at 1,000 iOS and Android apps with 5,000+ active users (see the full report here). Specifically, this post answers the questions:
- Why are there more star ratings for iOS apps than for Android apps?
- Why are there more reviews for Android apps than iOS apps?
App Ratings: iOS vs. Android
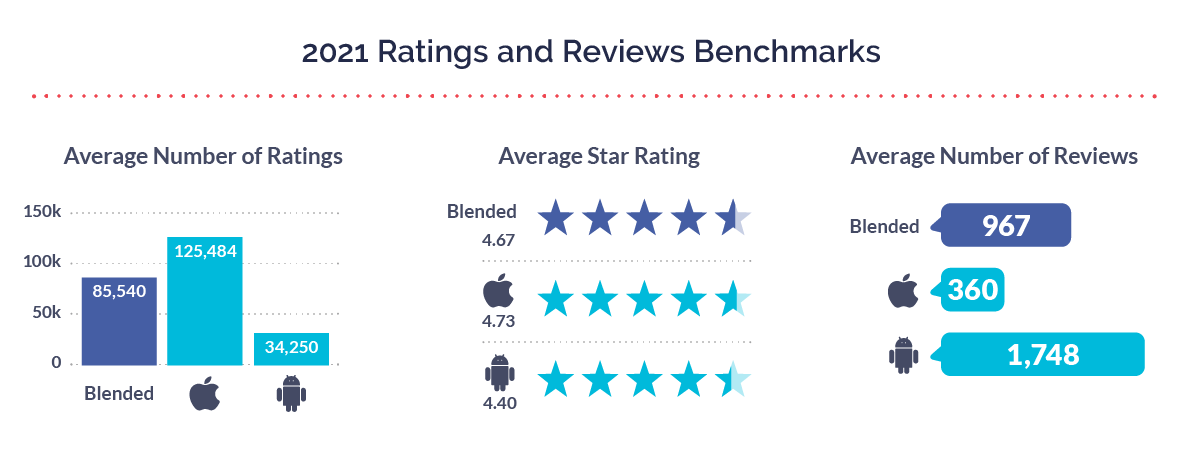
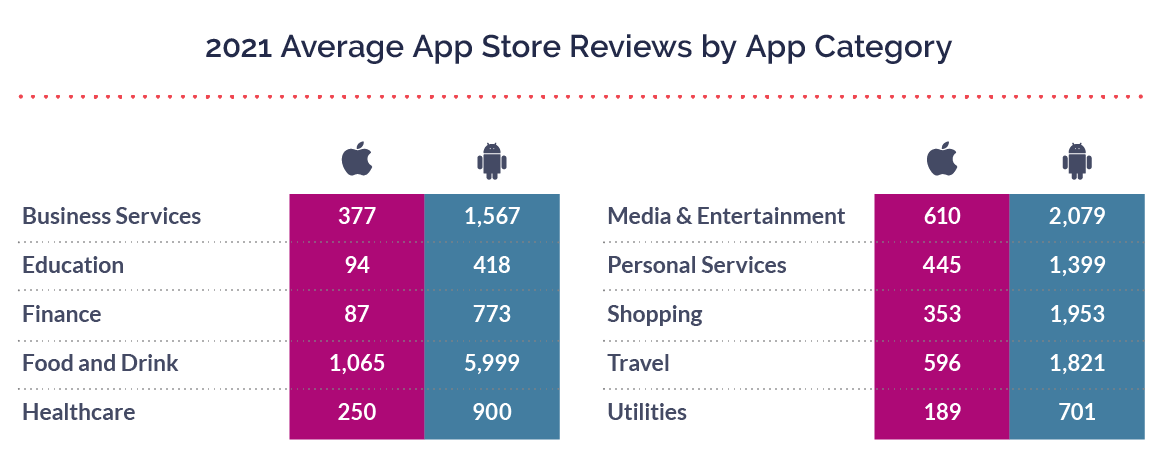
For the apps included in our study, the average star rating was 4.67. Overall, apps had an average of 85,540 ratings and an average of 967 app store reviews.
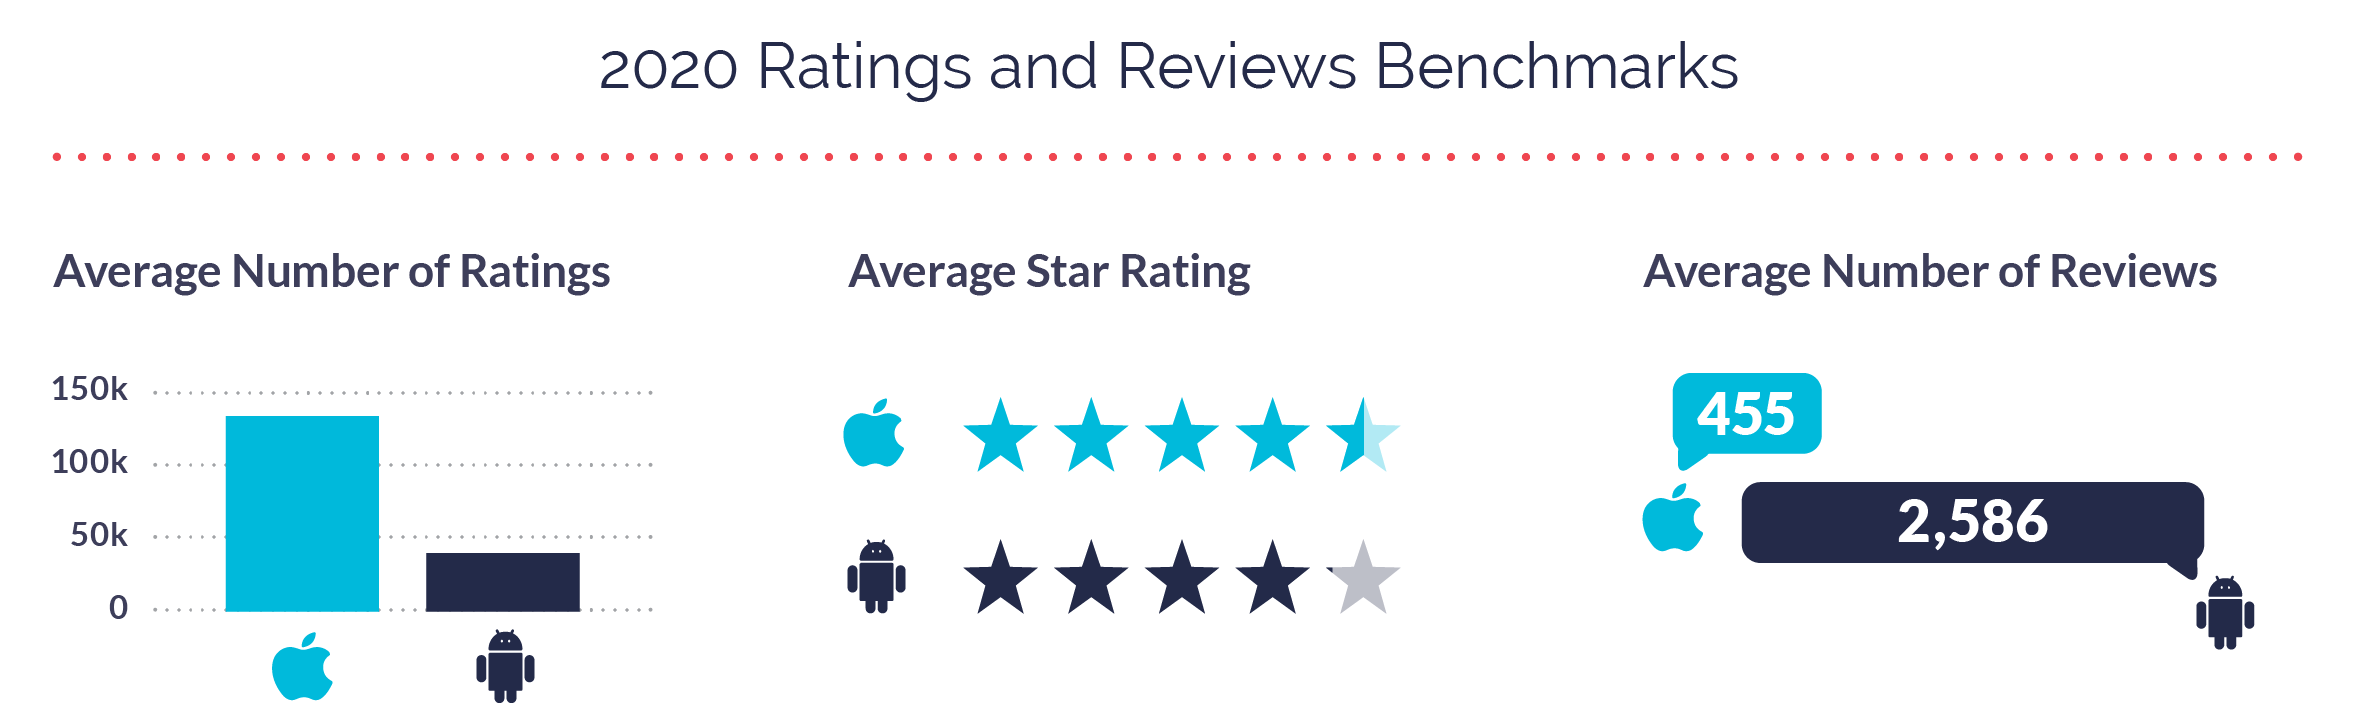
The average volume of star ratings in iOS apps decreased around four percent from 2020 to 2021. For Android apps the volume decreased around 11 percent during the same time frame.
These decreases and the differences between iOS and Android ratings can likely be attributed to the following factors:
- The user base between iOS and Android is different. Engagement means people are involved in the process, but it doesn’t mean they’re happy. When we see lower numbers, it doesn’t mean they aren’t engaged, it just means they have more of an opinion and are harder to please. This applies more toward younger generations who have grown up in the digital space and are used to providing all types of digital feedback.
- Changes in Apple’s behavior. Much like 2018, 2020 and 2021 have been chopping block years, where Apple reduced the overall app ecosystem. This is mostly a result of Apple cracking down on 1.6 million risky or untrustworthy apps in 2021.
- Changes in publisher behavior. Publishers on Apple and Android released over 2,000,000 new apps in 2021 compared to an estimated 1,560,000 in 2020. The increase in the amount of published apps could have brought down averages from 2020. Of the apps published in 2021, over 77 percent of all app releases were on Android. This likely explains why Android ratings averages changed at a higher rate than iOS app averages.
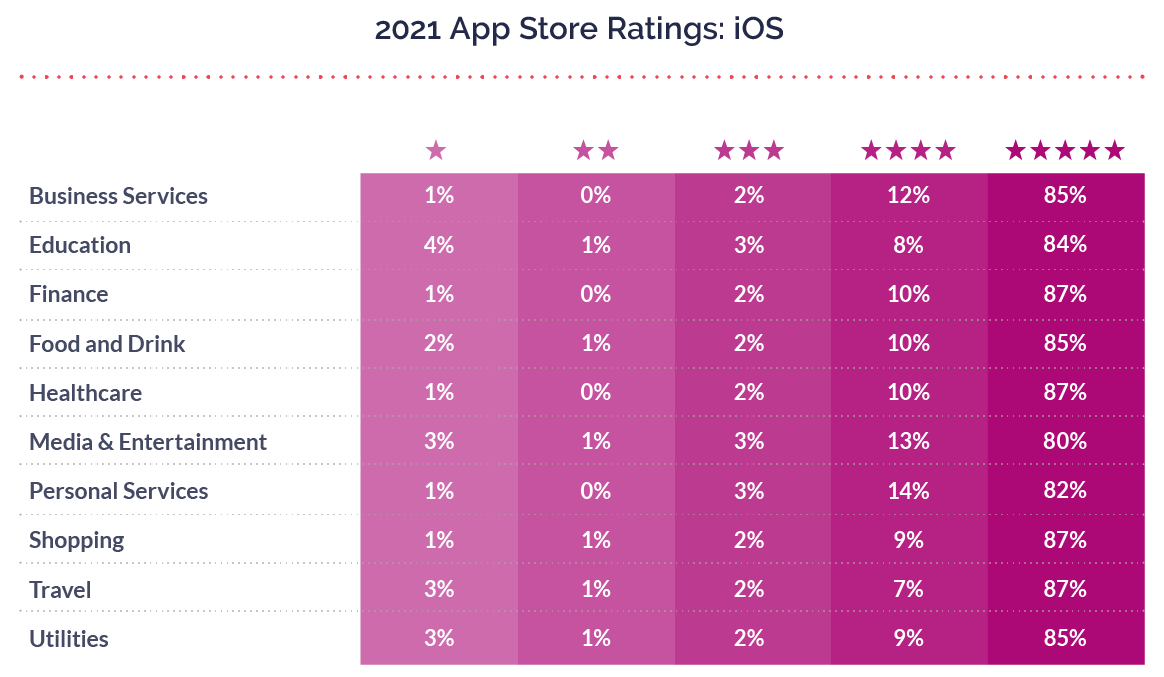
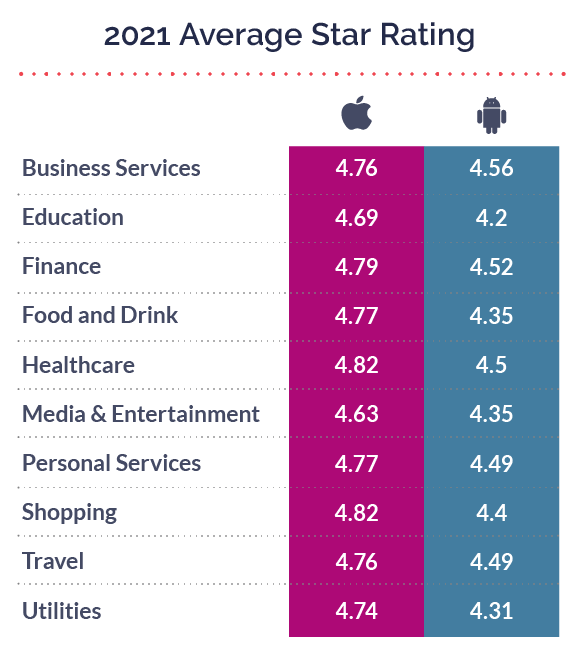
To go further in understanding the disparity between app store ratings, we first must understand the nuance between industries. When it comes to five-star apps, Shopping (87%) as an industry is competitive in a way that Media (80%) isn’t. For example, you are more likely to download the app of a new store than you would be to explore a new news source. You also likely use Shopping apps less frequently than a Media app which you may check on a daily basis. Higher usage means more opportunities to find flaws and more reason to leave a lower star rating. Travel (87%) also falls closer to the competitive side, where consumers are more likely to download and use multiple apps.
In 2020, of the ten industries we looked at, not a single industry had a five-star rating percentage over 83 percent. In 2021, eight out of ten industries had a five-star ratings distribution over 83 percent. In our opinion, the shift to mobile during the COVID-19 pandemic prompted many brands to allocate more time and resources to improving mobile customer experience and their app rating.
Android apps saw similar, across the board, improvements in their ratings distributions. In 2020, only two industries had an average five-star percentage over 70 percent. Now, eight out of ten industries have a five-star percentage over that mark.
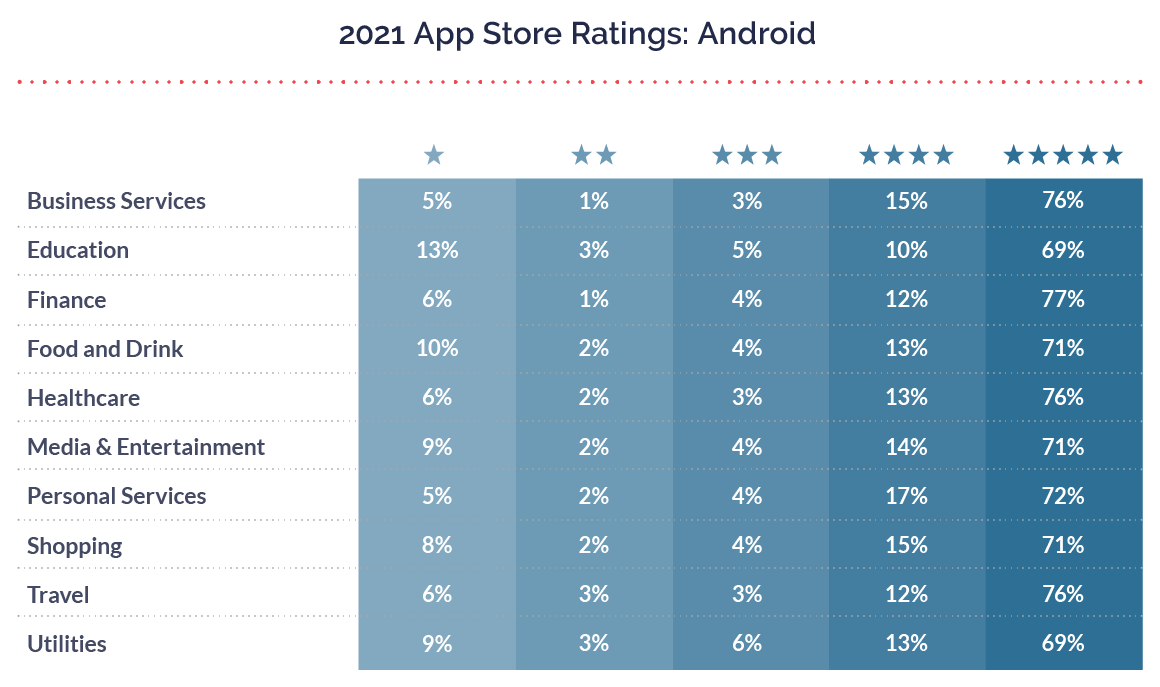
Education (69%) and Utilities (69%) lag behind the other industries on Android. This is to be expected because it is hard for individuals to easily jump to competitors in these spaces. With Education and Utility apps they are limited by geographic location or what education resources a particular school district or institution uses.
Media also falls behind other industry categories with an average rating of 4.35 on Android. Consumers tend to let bias around current events influence their public ratings (more on why this is bad and how to get ahead of it), a common occurrence in Media and Entertainment.
App Store Reviews: iOS vs. Android
The volume of iOS reviews per app decreased by 21 percent from 2020 to 2021. Android saw an even bigger decrease in volume of reviews at 33 percent, over the same time period. In the graph below, iOS review volume tends to go up and down every other year, but 2021 was the second consecutive year with a decrease in volume.
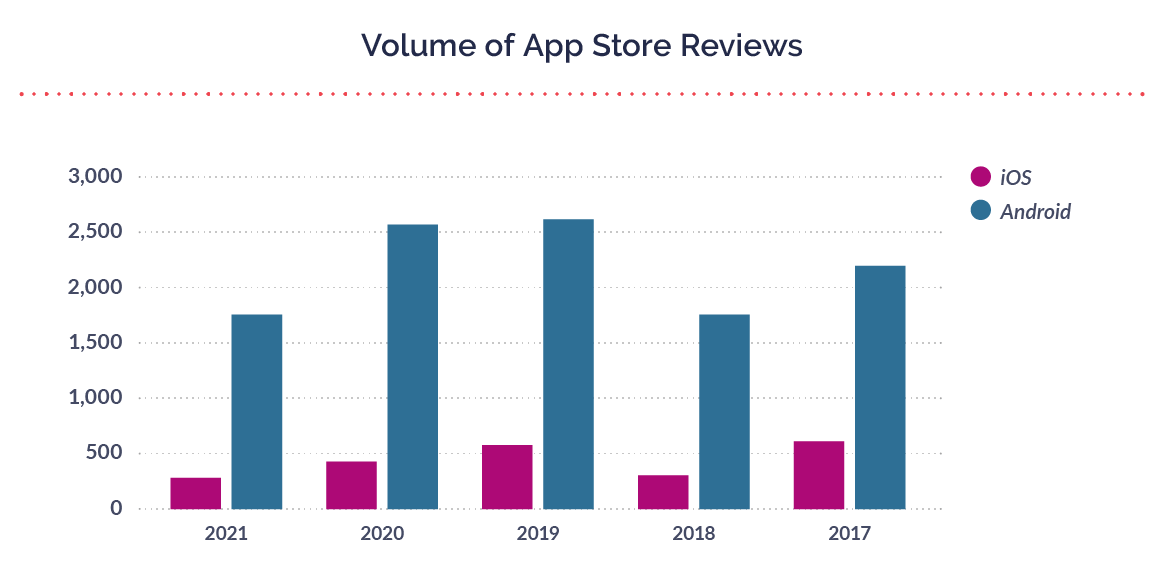
In general, there have always been more reviews on Android apps than on iOS, mostly due to the demographic differences of their customer bases. Android users tend to be younger and much more likely to feel involved in the process. Because of this, they’re also typically more critical (e.g. give lower ratings and more critical reviews).
Since the release of iOS 11 in 2017, we’ve seen a downturn in the number of iOS reviews as the rating process was simplified. Google also released big changes to its Play Store in-app review API in October 2020, which had a sweeping impact on how app publishers prompt for ratings and feedback. Ultimately, the changes to both app stores made the process of rating an app easier, less disruptive, and more inline with the goal of optimizing for consumer feedback rather than gamifying high ratings.
However, the number of app store reviews have steadily decreased as it’s harder for consumers to leave a review now that ratings prompts are decoupled. Decoupling refers to targeting customers for ratings separate from an audience that sees the Alchemer Mobile (formerly Apptentive) Love Dialog, or showing the Rating Dialog at another point in your customers app journey that is not immediately after the Love Dialog. Adding a step in the consumer feedback journey means that, by default, it will be harder and less likely that people complete the path.
Conclusion
App ratings and reviews aren’t just vanity metrics; they have real consequences on conversion rates and brand reputation. There is a direct correlation between an app’s star ratings and a consumer’s willingness to download that app.
Ultimately, the data tells us that ratings and reviews continue to play a major role in your app’s growth, long after consumers have found their way to your app store product page. They serve as social proof to indicate your app’s quality in an otherwise blind evaluation process. And now, in both app stores, review recency matters more than ever before, which means being able to continually identify and activate your fans is critical.
For more on improving your app’s ratings and reviews check out our 2022 Mobile Customer Engagement Report or request an Alchemer Mobile (formerly Apptentive) demo!