Many of the biggest brands in the world, including CNN, eBay, Safeway, Marriott, and FanDuel, trust Alchemer to engage and connect with their customers.
How it Works
Transform data into strategic action
Effortlessly collect, analyze, and deliver actionable guidance—at any scale.
Launch projects in hours, not weeks
Quickly launch surveys without lengthy, painful implementation.
Get more value, with no hidden costs
Predictable pricing means unlimited surveys, questions, and reports, and no pay-per response.
Configure design and delivery
Craft powerful surveys with advanced question types and custom logic.
Deliver meaningful results, faster
View powerful insights right in Alchemer—or analyze your data in the tools you already use.
UNMATCHED FLEXIBILITY
Customize and launch precise surveys
Create surveys with powerful logic, diverse question types, and advanced customization options, right out of the box. Or build surveys to your exact needs with custom scripting.
Get better answers with 40+ question types Gather actionable data with everything from Likert Scales to Conjoint, MaxDiff, and more.
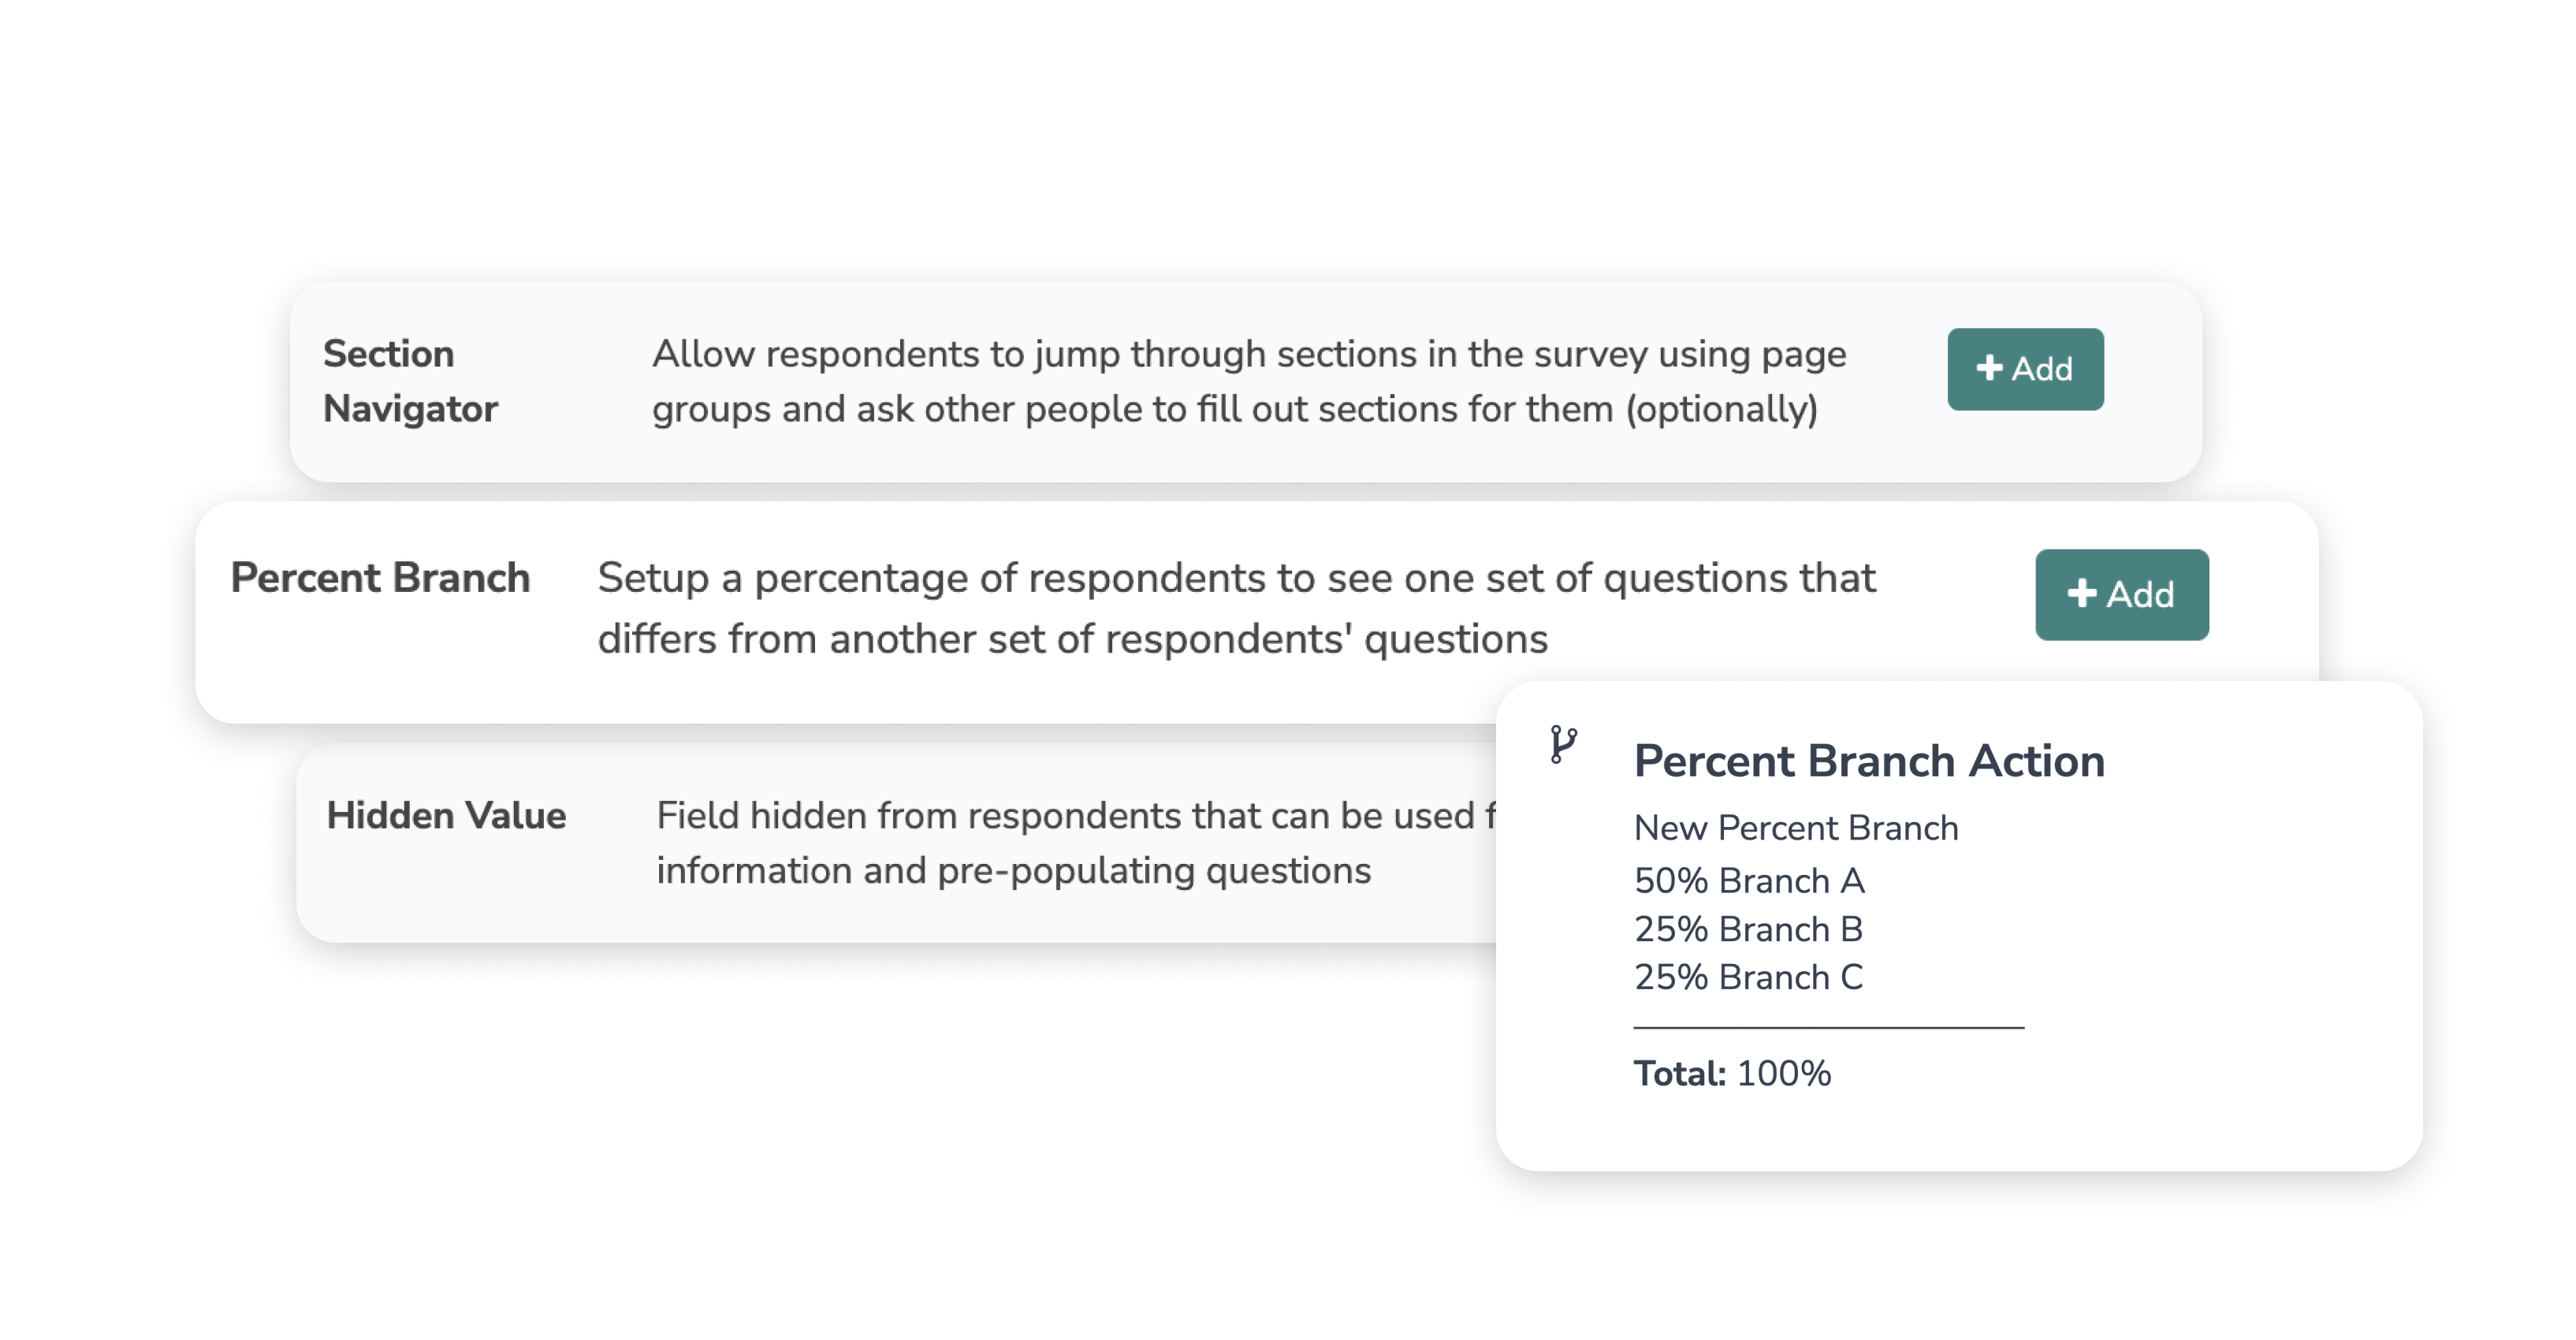
Tailor surveys with advanced logic Get more complete responses and collect better data with advanced features like answer piping, branching and skip logic, quotas, and disqualifications.
Reach your audience where they are Send surveys through email, web, and SMS, and find the right panel audience, anywhere in the world.
Customize any part of the survey experience Leverage custom scripting and the Alchemer API to customize any aspect of survey design and delivery
ADVANCED ANALYTICS
Deliver insights that drive results
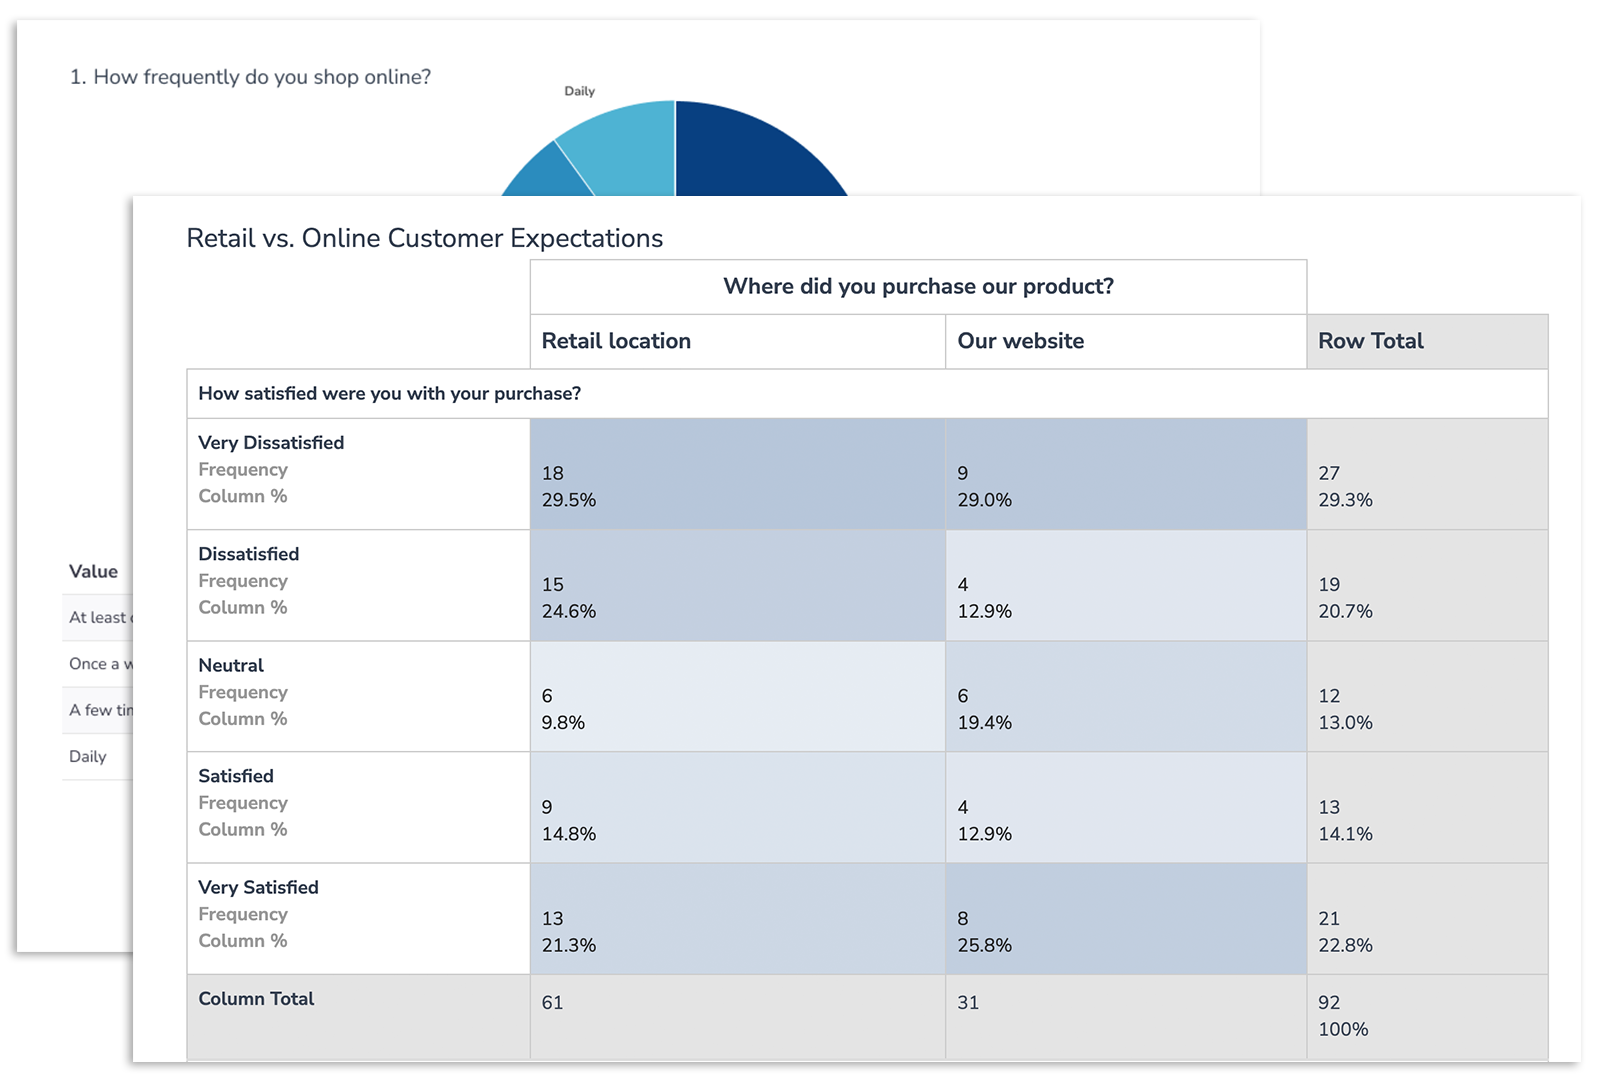
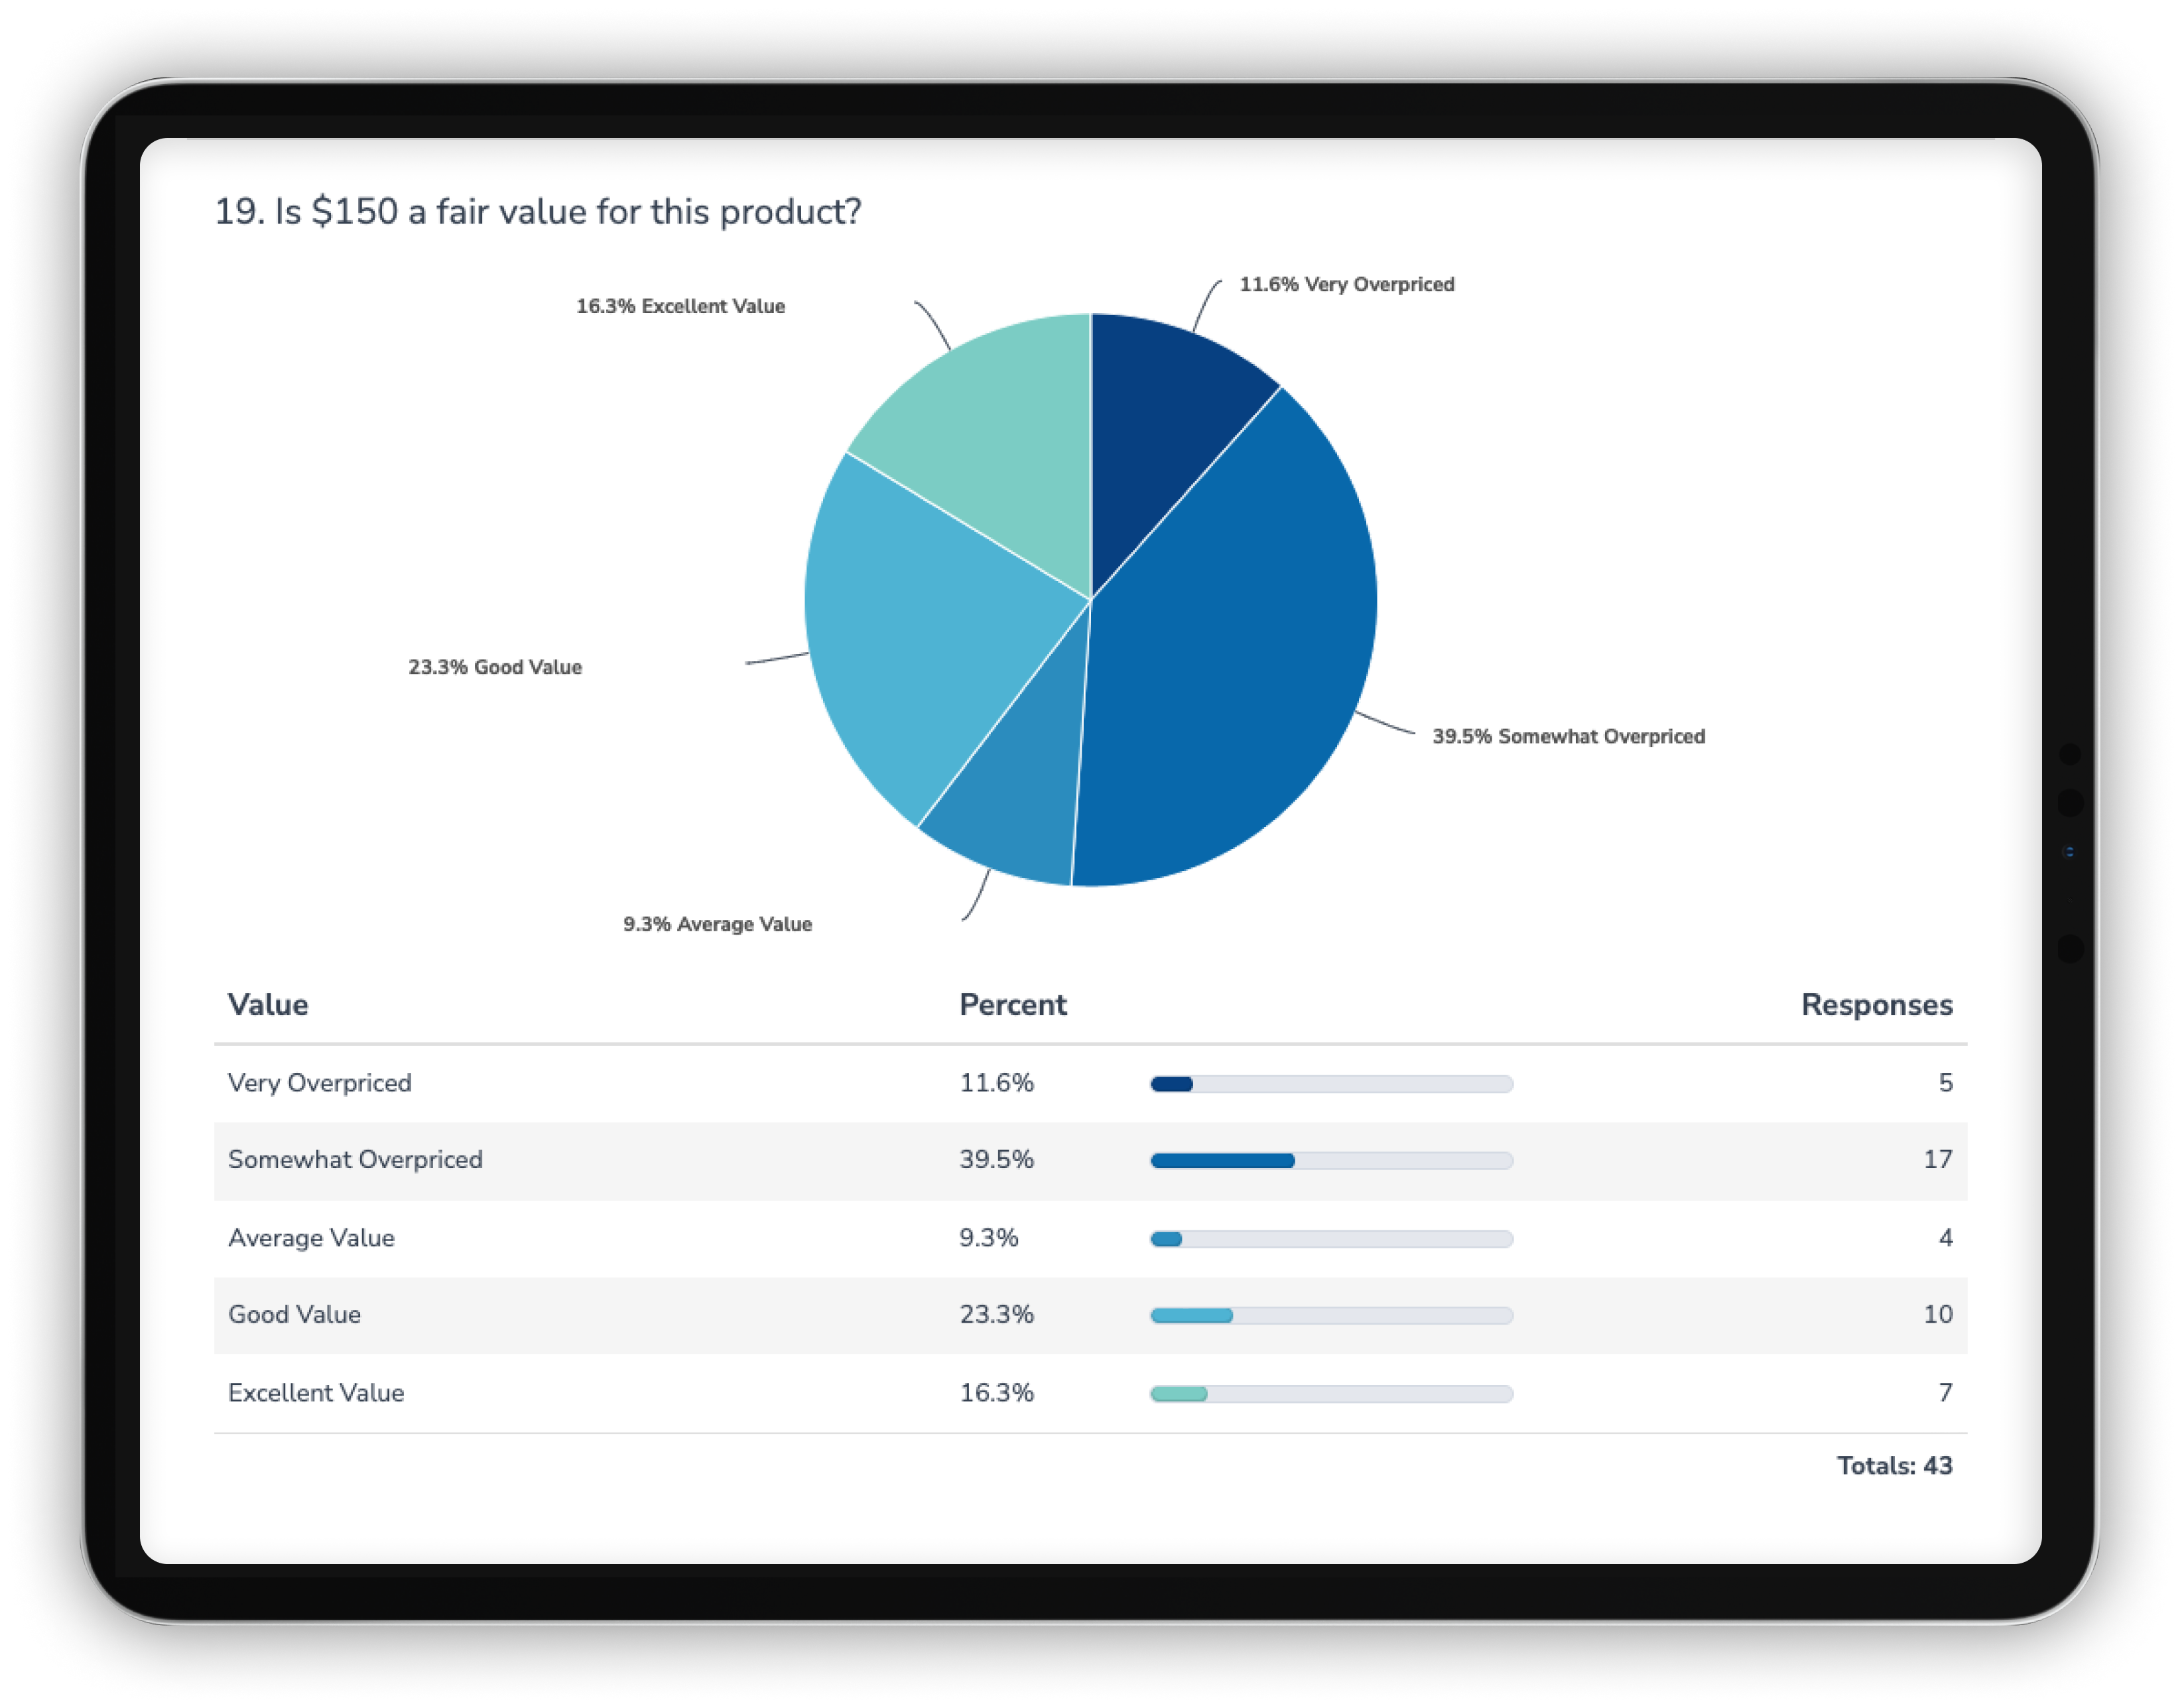
Gather quick insights with out-of-the-box reporting
Create and customize advanced reports like TURF, cross tabs, and comparison faster than ever before
Export data directly to SPSS and Excel for deeper analysis.
EASY-TO-USE SURVEY FEATURES
Work smarter and faster—not harder
Alchemer is built for the needs of market researchers and strategists, so you can spend less time on administrative work, and deliver results faster.
Easily share findings with clients Create unlimited reports tailored to each stakeholder—and share secure results that update in real-time.
Work with your existing tech stack Integrate with third-party software like Tableau, Salesforce, Microsoft Dynamics, and Google Sheets, and create custom integrations with tools you already use.
Design the perfect experience for your needs Get complete brand control with branded URLs and domains, custom themes and styling, and more.
I spent 80% less time programming surveys. I’m not limited, and neither are my respondents because Alchemer offers a platform that is much more accessible than anything we’ve had before.
– Mary Ann M., Researcher,
Professional Development and Research Institute on Blindness (PDRIB)