Skip to content
Products
Close Products
Open Products
Products
Survey
Industry leader in flexibility and ease of use
Digital
Collect real-time digital feedback from your website or app
Pulse
Turn noisy text feedback into signals you can act on
Integrations & Automations
Connect data across systems to drive faster outcomes
Dashboard
Turn feedback into results
Services
Research Solutions
Trusted market research that will turn you into the expert
Brand Health Tracker
Brand performance insights at your fingertips
Professional Services
Custom-fit Alchemer Survey and Workflow to your business
Training
Product training for every level, at every stage
Solutions
Close Solutions
Open Solutions
Industries
Government
Education
Non-Profit
Financial Services
Food & Beverage
Retail
Software
Hospitality
Solutions
Customer Experience
Market Research
Employee Engagement
Resources
Close Resources
Open Resources
Blogs
Case Studies
Webinars
eGuides
Resource Library
From the Blog
Introducing Alchemer Research Solutions
Pricing
1-800-609-6480
Support
Login
Request a Demo
Blog
Customer Story
Survey Tips
Solutions
Features
Company News
Press Release
Market Research
Product News
Subscribe to our blog
Mobile Marketing
Alchemer Mobile
,
Mobile Marketing
Build vs. Buy: Evaluating Third-Party Mobile SDKs
Alchemer Mobile
,
Mobile Marketing
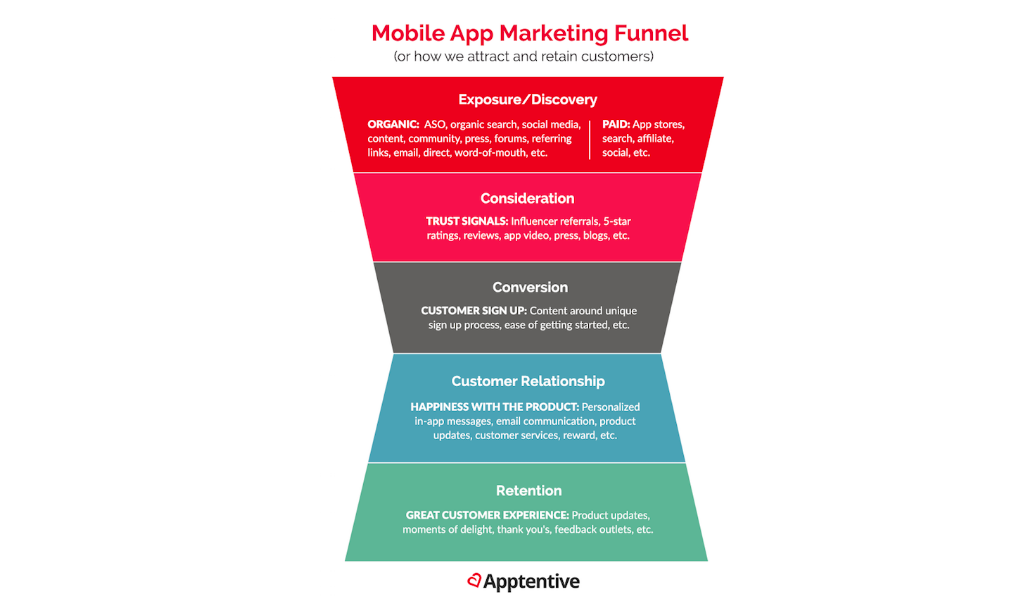
The Mobile App Marketing Funnel
12 min
Alchemer Mobile
,
Mobile Marketing
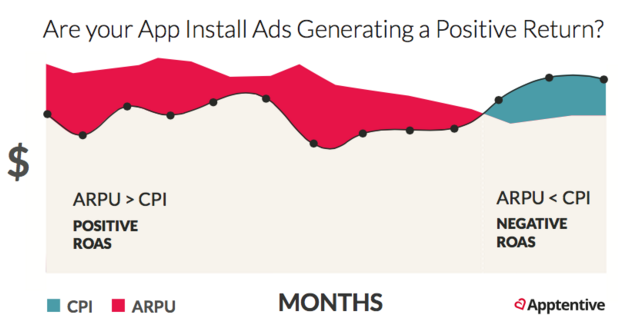
Return on Ad Spend: A New Metric For 2016’s Mobile Ecosystem
7 min
Alchemer Mobile
,
Mobile Marketing
App Marketing Metrics for Pirates: Commandeering the Purchase Funnel
Alchemer Mobile
,
Mobile Marketing
,
Product Management
,
Targeting & Remarketing
Pull, Don’t Push: 5 Steps for Personalized App Marketing
Alchemer Mobile
,
Mobile Marketing
,
Product Management
Brick and Mobile: A Shift in Retail Commerce & Engagement
Alchemer Mobile
,
Mobile Marketing
,
Product Management
The Mobile Shopper Is Here: New Survey Finds 88% of Respondents Use Retail Mobile Apps
Alchemer Mobile
,
Guest Post
,
Mobile Marketing
6 Ways to Market Your Mobile Game
Alchemer Mobile
,
Guest Post
,
Mobile Marketing
Validation: Check Yourself Before You Wreck Yourself
8 min
Alchemer Mobile
,
Guest Post
,
Mobile Marketing
5 Pillars of a Successful Facebook App Install Ad Campaign
11 min
Alchemer Mobile
,
Mobile Marketing
,
Product Management
Rethinking the Mobile Surveys vs. Web Surveys Debate
11 min
Alchemer Mobile
,
Guest Post
,
Mobile Marketing
Reasons and Solutions for a Broken App Discovery
< Previous
Page
1
…
Page
8
Page
9
Page
10
Page
11
Next >
Start making smarter decisions
Contact Sales
Start a Free Trial
Get your monthly dose of Alchemer insights!
Each month, we’ll bring you expert tips, valuable resources, and fresh ideas to help you turn insights into action and drive your organization forward.
By accessing and using this page, you agree to the Terms of Use. Your information will never be shared.
Subscribe to our Blog