Today, we bring you the second post in our The New App Marketing Metrics series (see the first post here). 
In our first installment, we discussed why it’s time to ditch installs for uninstalls as a method of measurement.
This time, we suggest swapping out Cost Per Install (CPI) with Return on Ad Spend (ROAS) as a better way to guide your limited advertising dollars.
Read on for the methodology behind our theory, along with some tips to make ROAS work for you as a primary ad spend metric. Let’s dive in!
Update: We’ve concluded this series.Check out all six installments with the links below. Or, download the complete series in pdf form. |
Cost Per Install (CPI): Just one piece of the puzzle
Cost Per Install is widely regarded as the dominant factor in cost-benefit analyses of paid advertising campaigns. It’s a metric that spreads your advertising cost over all installs generated by those ads. It’s also a metric that fails to take into account the increasingly complex nature of mobile marketing.
When mobile apps first caught on, the Cost Per Install metric was a favorite of marketers everywhere for its familiarity. The metric relied on the same intuition that guided digital marketing for years:
Minimize cost (in digital, PPC or CPM) and maximize results (clicks, impressions).
Yet, as we’ve seen above, mobile app marketing is more complicated than this simple rule of thumb suggests (as is modern digital marketing, shown in its movement toward attributional metrics). The rule of thumb works well when there’s a small number of ad networks to choose from and a consistent, definable value that you can place on each result, or ad-generated install.
In mobile, we don’t just have Google and Bing to navigate. Today, there are hundreds of advertisement display networks, ranging from programmatic to geolocal, affiliate, and everything inbetween. Each network specializes in different customer segments and has a slightly different variation and CPI metric. Knowing the cost of working with any one network is a start, but tells you nothing about the opportunity cost of not working with any of the networks that could offer superior results.
Similarly, thanks to the rise of mobile ad blocking and dwindling app retention rates, simply calculating your average revenue per user is no longer enough to guide your CPI investment through cost-benefit analysis.
According to MediaPost, as many as 20% of millennials use a mobile ad blocker, while an additional 16% “want to” but do not know of any compatible with their devices. When it comes to the desktop, 63% of millennials employ ad blockers, indicating just how devastating this trend can become to the mobile advertising industry. And in fact, we’re already seeing its implications with acquisition costs reaching unprecedented heights and expected to only increase as ad blocker adoption grows.
Even among those ads that do surface, few generate the sort of loyal customers that marketers anticipate when factoring in the hefty cost of paid acquisition. As we saw in the first post in our series, few of your newly acquired customers will continue to use your app after the first week—meaning that much of your advertisement expenses are going toward unprofitable ads. Fiksu research echoes our findings, revealing that the cost of acquiring a loyal customer (defined as someone who opens your app at least three times) is 2-3 times greater than that of the original CPI.
In light of these complications, knowing your customer acquisition costs is necessary but not sufficient in guiding your investment decision.
Return on Ad Spend (ROAS): The confidence of a calculable return
In the rapidly evolving mobile ad landscape of 2016, marketers require a more robust metric to guide their ad dollars. They require a metric that tells not just the absolute cost, but the relative cost as well. They require the warranty that they’re not just making a good decision, but the best decision—one that maximizes profits while minimizing costs (both in absolute and opportunity terms). In other words, they require a quantifiable and predictive return for their ad spend investment.
Whereas CPI falls short when it comes to relative costs, Return on Ad Spend (ROAS) does the job well by measuring your ad spend directly against the results it produces. While the results you’re interested may be in terms other than monetary, ROAS typically takes the form of:
If you’re measuring your anticipated return in dollars, you’ll be left with a single value for ROAS. This value allows you to allocate your marketing budget with confidence, with two simple, yet effective guidelines:
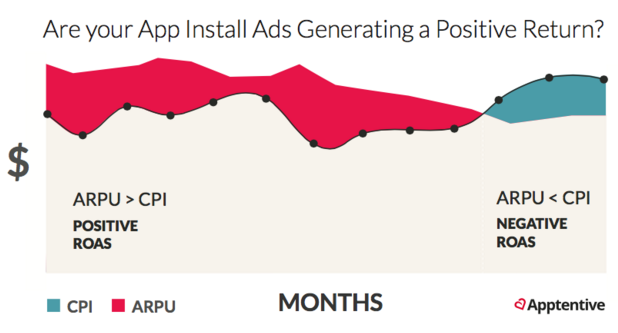
- Continue investing in ads, if ROAS is positive (that is, profit from ad campaign > ad spend)
- Allocate your budget elsewhere, if ROAS is negative (that is, ad spend > profit from ad campaign)
While this math may seem elementary, app publishers continue to throw money away on campaigns that cost more than they’re worth. We see this most commonly in the mobile game category, where the average ROAS sits around -$1, meaning every player introduced to the game by an ad costs the publisher a dollar.
In addition to directing your ad dollars, ROAS makes comparing the anticipated returns of different ad networks possible. This single monetary value can be directly compared across campaigns and across ad networks to show where your dollars can be spent most effectively. Instead of comparing an array of incompatible acronyms (CPI, CPLU, CPM, CPC, CPA), ROAS leaves you with just one number that remains meaningful and relevant regardless of the eccentricities of the campaign.
Now that’s a metric worthy of 2016.
Another week, another metric
Every week for the next month, we’ll be showcasing one new app marketing metric worthy of a spot in your 2016 toolkit. So far, we’ve looked at Return on Ad Spend and App Uninstalls, two underutilized metrics with the power to capture a more comprehensive picture of your app marketing. Used in tandem, these two metrics shed important insight into your app’s health that go missed when only considering their Install and Cost Per Install equivalents. Namely, they allow you to identify the profit margin of each acquired customer, taking into account expected retention rates.
In future installments, we’ll look at four more metrics that beef up your performance reporting for 2016. Each of these metrics, like ROAS and Uninstalls, are simple deviations from their more traditional counterparts but add a new layer of complexity to allow for more data-driven decision making.
> Update: Continue on to Part III of this series: Quality Matters: Harnessing the Power of Push to Drive Retention. Or, download our free eBook, The New App Marketing Metrics, to get all six metrics in pdf form!


