Skip to content
Products
Close Products
Open Products
Products
Survey
Industry leader in flexibility and ease of use
Digital
Collect real-time digital feedback from your website or app
Pulse
Turn noisy text feedback into signals you can act on
Integrations & Automations
Connect data across systems to drive faster outcomes
Dashboard
Turn feedback into results
Services
Research Solutions
Trusted market research that will turn you into the expert
Brand Health Tracker
Brand performance insights at your fingertips
Professional Services
Custom-fit Alchemer Survey and Workflow to your business
Training
Product training for every level, at every stage
Solutions
Close Solutions
Open Solutions
Industries
Government
Education
Non-Profit
Financial Services
Food & Beverage
Retail
Software
Hospitality
Solutions
Customer Experience
Market Research
Employee Engagement
Resources
Close Resources
Open Resources
Blogs
Case Studies
Webinars
eGuides
Resource Library
From the Blog
Introducing Alchemer Research Solutions
Pricing
1-800-609-6480
Support
Login
Request a Demo
Blog
Customer Story
Survey Tips
Solutions
Features
Company News
Press Release
Market Research
Product News
Filters
Search
×
Show
(
809
)
Cancel
Subscribe to our blog
Alchemer Mobile
,
Brand & Reputation Management
,
Mobile Marketing
How to Manage Brand Reputation on Mobile Channels
23 min
Alchemer Mobile
,
Customer Experience
,
Product Management
The Best Product Management Quotes from Top Industry Leaders and Influencers
4 min
Alchemer Mobile
,
Customer Experience
,
Mobile Marketing
,
Product Management
Voice of the Customer Technology Buying: Turn Fear Into Power
Press Release
Alchemer Launches Activated NPS Solution
2 min
Alchemer Mobile
,
Customer Emotion & Sentiment
,
Customer Experience
,
Mobile Marketing
,
Product Management
How Customer Emotion Impacts Customer Sentiment
6 min
Customer Feedback
,
Integrated Feedback
Closing the Customer Feedback Loop Done Right
Customer Feedback
,
Integrated Feedback
Putting Feedback Into Action
Alchemer Mobile
,
Guest Post
,
Product Management
Top UI Design Tools for Creating Mockups and Prototyping
Alchemer Mobile
,
Customer Experience
,
Loyalty & Retention
,
Mobile Marketing
,
Product Management
Strategies to Help Food and Drink Brands Improve Customer Engagement
Press Release
G2 Crowd Crowns Alchemer an Industry Leader
3 min
Company News
,
Customer Feedback
Business Users Love Alchemer
Alchemer Mobile
,
Customer Experience
,
Loyalty & Retention
,
Mobile Marketing
,
Product Management
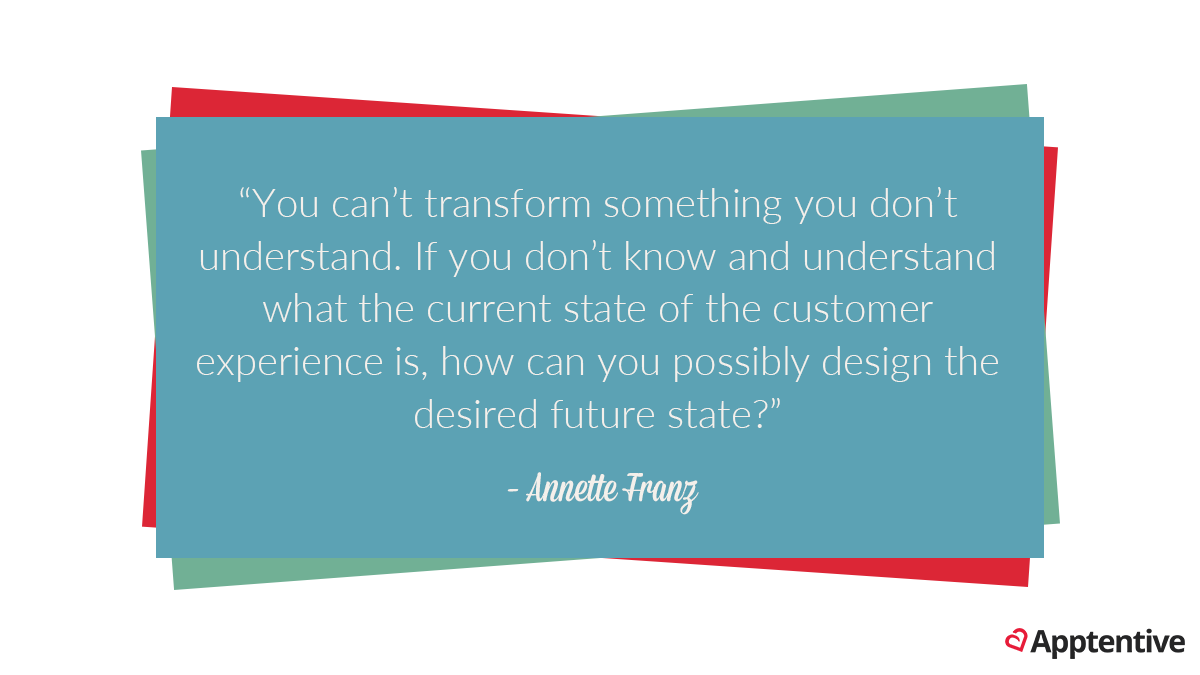
The Best Customer Experience Quotes
< Previous
Page
1
…
Page
30
Page
31
Page
32
Page
33
Page
34
…
Page
68
Next >
Start making smarter decisions
Contact Sales
Start a Free Trial
Get your monthly dose of Alchemer insights!
Each month, we’ll bring you expert tips, valuable resources, and fresh ideas to help you turn insights into action and drive your organization forward.
By accessing and using this page, you agree to the Terms of Use. Your information will never be shared.
Subscribe to our Blog