Alchemer Pulse

See how Alchemer Pulse empowers your team
to act on unstructured feedback at scale.

A woman with dark hair in buns and wearing glasses is smiling to the left of the camera, wearing a pink collared blazer.

Solve revenue-impacting customer issues, fast.

Understand why NPS scores drop, what causes customer churn, and how your CX program impacts the business.

Lisa, VP of Customer Service

Customer Experience

A woman with dark hair in buns and wearing glasses is smiling to the left of the camera, wearing a pink collared blazer.

“Hey, team. We’re seeing more negative feedback this quarter—let’s dig into what’s going on.”

Lisa, VP of Customer Experience

Analyze all of your customer feedback in one place

Customer feedback is tough to parse when it’s coming from multiple sources, and multiple teams are trying to make sense of it.

Pulse unifies text based feedback from all your surveys, product reviews, and more—giving you one source of truth for all your customers’ thoughts and feelings.

A sentiment analysis infographic showing a net sentiment score of -9. It includes percentages for positive (42%), negative (51%), and neutral (8%) sentiments, based on 12,478 responses. Highlighted reviews discuss product style and quality issues.
Bar chart showing net sentiment scores for various categories: Quality (-10.34), Refunds, Support, Stitching, Style, and Fit (8.91). Accompanying text highlights customer concerns about declining quality, shipping costs, and support wait times.

Customer Experience

A man with a beard is smiling at the camera, wearing a white shirt and a dark zip-up sweater. The background is plain gray.

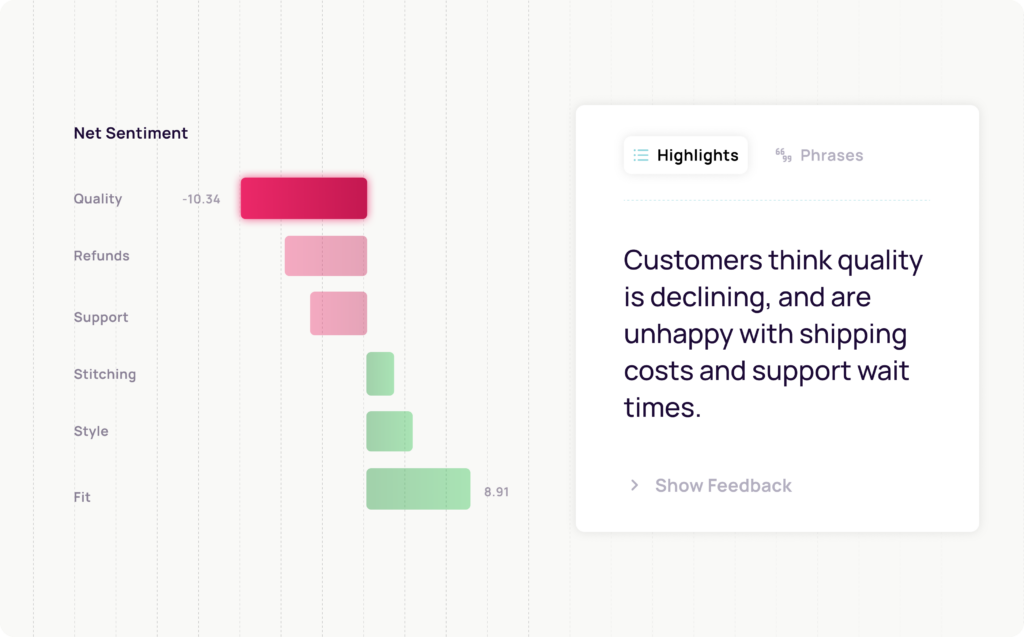
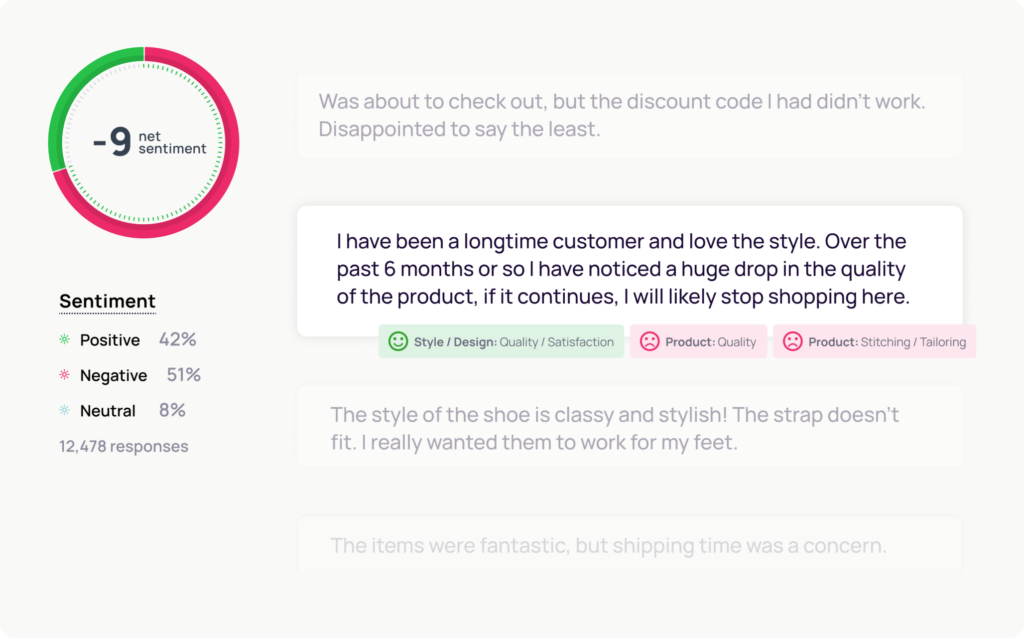
“60% of our customers love us—but there’s been a spike in complaints from loyal buyers about quality, and many are impatient with support.”

Ben, VP of Product

Understand every step of the customer experience

Pulse shows you how customer sentiment impacts key business metrics—not just indicating scores like NPS and CSAT, but the underlying issues that affect customer loyalty, retention, lifetime value, and more.

Customer Experience

A woman with short dark hair is smiling at the camera, wearing a white shirt and black striped shirt. The background is light green.

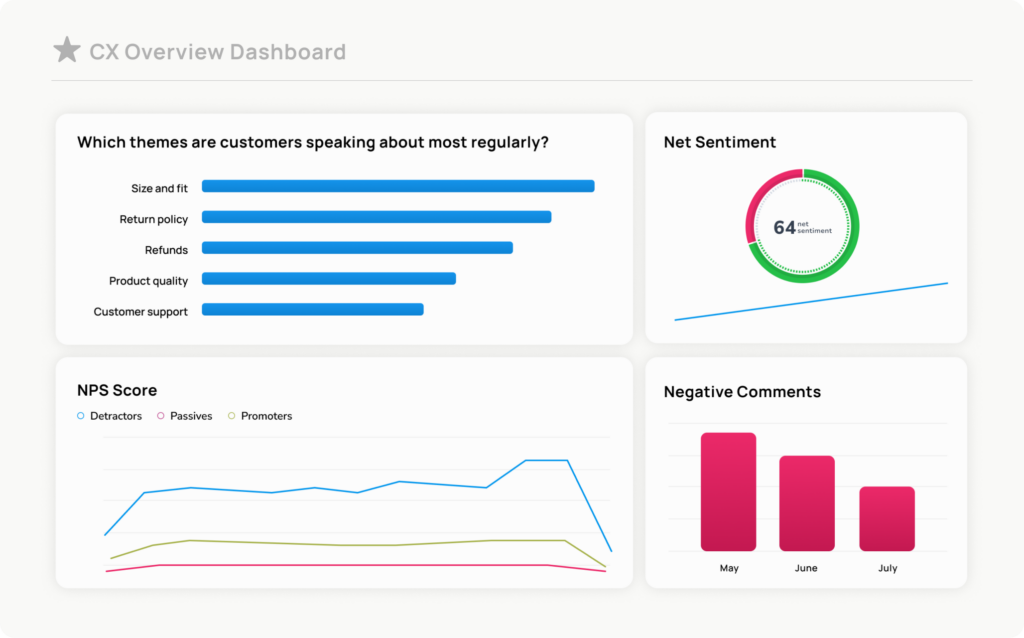
“I’ve created a new CX dashboard for the team—let’s get the right people activated.”

Alex, Director of Customer Support

Align teams and lead cross-functional solutions

Pulse unifies text feedback from surveys, review sites, support tickets, and more—showing you what customers really think and feel about every aspect of your business.

A dashboard displaying customer experience metrics. The left chart ranks themes: Size and fit, Return policy, Refunds, Product quality, Customer support. Top right: 64% net sentiment gauge. Bottom: NPS score line graph, negative comments bar chart.
A bar and line graph with three bars and a declining line trend. To the right are icons with check marks and text: Clearer link between NPS, CSAT, and revenue, Deeper understanding of early churn indicators, Proven CX impact on revenue growth & retention, Improved speed to customer insights from data analysis.

Customer Experience

A collage featuring three smiling people, with two additional individuals indicated by +2. The first person has glasses and a bun, the second person has a beard, and the third person has short curly hair.

“Good news! We’ve reached out to unhappy customers and returns are down 20%. We’ll know if anything changes.”

Turn customer feedback into business growth

Pulse helps you tie trends in customer feedback to real business outcomes, so you can move faster and connect the dots between CX efforts, business strategy, and revenue growth.

A man with a beard is smiling at the camera, wearing a white shirt and a dark zip-up sweater. The background is plain gray.

Optimize product strategy
and revenue

Understand what users really care about, prioritize the right features on your roadmap, and identify issues in real time.

Ben, VP of Product

Product

A man with a beard is smiling at the camera, wearing a white shirt and a dark zip-up sweater. The background is plain gray.

“App adoption has tanked after our most recent update. Any ideas?”

Ben, VP of Product

Create one source of truth for open-text user feedback

It’s easy to miss user issues when you’re juggling multiple sources of feedback—and too many product teams feel completely disconnected from their customers.

Pulse unifies text feedback from your customer surveys, digital feedback channels, product reviews, and more—giving you one source of truth for all your customers’ thoughts and feelings.

Image showing a sentiment analysis dashboard. It displays a gauge with a net sentiment of -9. Below, theres a dialogue box highlighting customer feedback about quality concerns. Sentiment breakdown: 42% positive, 51% negative, 8% neutral out of 12,478 responses.
Bar chart showing net sentiment scores for various categories: Quality (-10.34), Refunds, Support, Stitching, Style, and Fit (8.91). Accompanying text highlights customer concerns about recent app updates.

Product

A woman with dark hair in buns and wearing glasses is smiling to the left of the camera, wearing a pink collared blazer.

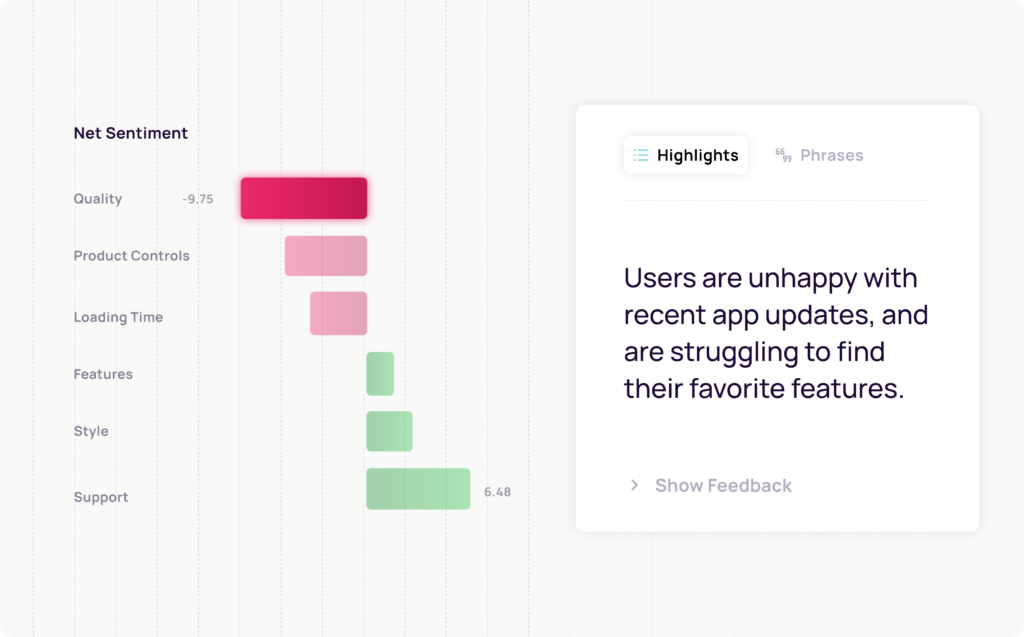
“Looks like our new nav is driving customers away—we hid a few key features last month and it’s impacting adoption. We have to move fast.”

Lisa, VP of Customer Service

Understand what customers think about every product touchpoint

Pulse reveals what your customers think and feel about every aspect of your product, so you see the context behind customer sentiment and identify the top drivers of negative and positive feedback. That way, you can get to the root cause of customer issues, identify what resonates with your users, and build a data-driven product strategy.

Product

A woman with short dark hair is smiling at the camera, wearing a white shirt and black striped shirt. The background is light green.

“We’re collecting feedback on the new designs—I’ve given an updated roadmap to our support teams so they can adjust as well.”

Alex, Director of Customer Support

Monitor issues and track your impact in real time

Customizable dashboards let you track feedback and sentiment as it comes in, so you can watch how updates are received, see issues emerge, and catch potential problems before they snowball. Then, you can align all your cross-functional teams on what needs to be tackled, and build org-wide solutions that solve real business problems.

A dashboard displaying customer experience metrics. The left chart ranks themes: Size and fit, Return policy, Refunds, Product quality, Customer support. Top right: 64% net sentiment gauge. Bottom: NPS score line graph, negative comments bar chart.
A bar graph with three bars in blue, pink, and green, overlaid with a line graph. To the right are icons with text: prioritize high ROI initiatives, identify churn causes, detect issues early, and stay ahead of competition.

Product

A collage featuring three smiling people, with two additional individuals indicated by +2. The first person has glasses and a bun, the second person has a beard, and the third person has short curly hair.

“Our next update will improve core experience, and marketing is reaching out to unhappy customers. We’re already seeing results.”

Deliver products your customers love

Pulse gets you closer to your customers than ever before. You can understand customer needs in their own words, track sentiment in real time, and prioritize your roadmap based on what customers really want—that way, every team is aligned, and every decision moves you forward.

A woman with short dark hair is smiling at the camera, wearing a white shirt and black striped shirt. The background is light green.

Drive higher customer loyalty and retention

Understand why customers really contact support, triage and resolve issues faster, and improve customer retention.

Alex, Director of Customer Support

Customer Support

A woman with dark hair in buns and wearing glasses is smiling to the left of the camera, wearing a pink collared blazer.

“We’re seeing a drop in customer retention this quarter—what’s going on?”

Lisa, VP of Customer Experience

Unify all your open-text support feedback

Customer feedback is tough to parse when it’s coming from multiple sources, and multiple teams are trying to make sense of it—support teams can get caught in the middle.

Pulse unifies text feedback from your support surveys, and gives you a comprehensive view of how your customers feel about every aspect of your business.

Image showing a sentiment analysis dashboard. It displays a gauge with a net sentiment of -9. Below, theres a dialogue box highlighting customer feedback about quality concerns. Sentiment breakdown: 42% positive, 51% negative, 8% neutral out of 12,478 responses.
Bar chart showing net sentiment scores for various categories: Quality (-10.34), Refunds, Support, Stitching, Style, and Fit (8.91). Accompanying text highlights customer concerns about declining quality, shipping costs, and support wait times.

Customer Support

A man with a beard is smiling at the camera, wearing a white shirt and a dark zip-up sweater. The background is plain gray.

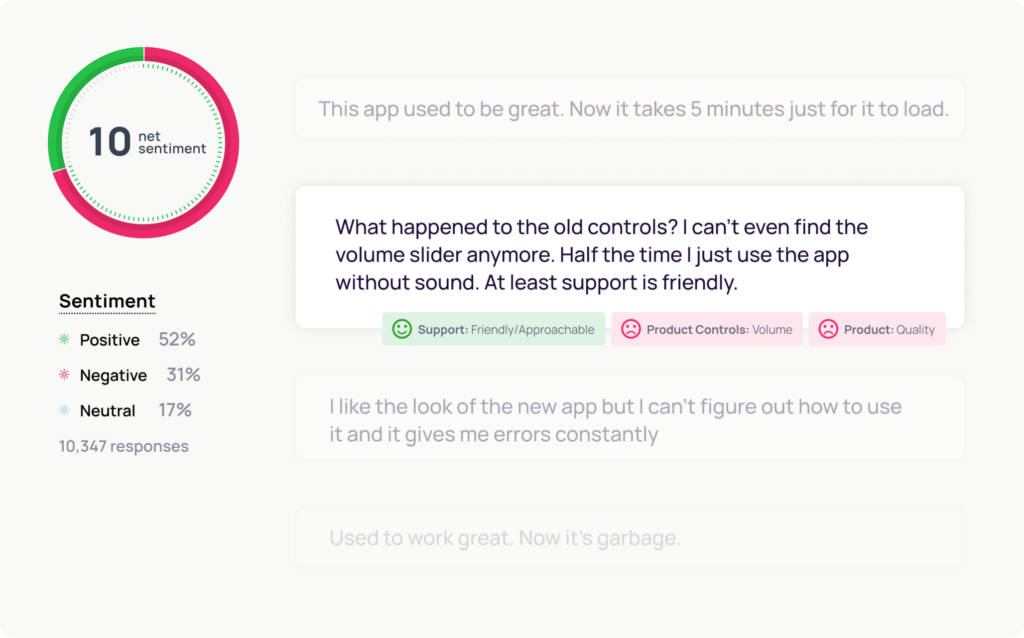
“Our CSAT score is declining—but it looks like product and logistics issues are driving feedback volume up and satisfaction down.”

Ben, VP of Product

Understand why customers really contact support

Pulse shows you what really impacts key business metrics—not just indicating scores like NPS and CSAT, but the underlying issues that affect customer loyalty, retention, lifetime value, and more.

Customer Support

A woman with short dark hair is smiling at the camera, wearing a white shirt and black striped shirt. The background is light green.

“Operations is looking into logistics solutions, and we have an auto-response with a coupon for customers experiencing delays.”

Alex, Director of Customer Support

Monitor feedback trends in real time

Customized dashboards show you key metrics—like NPS, CSAT, feedback volume, and more—in real time. That way, you can detect and triage issues faster, improve your operational efficiency, and track exactly how your efforts impact business outcomes like loyalty and retention. And it’s easy to direct cross-functional issues to the right team’s attention—like product, operations, marketing, and others.

Dashboard displaying: a bar chart on customer themes (size/fit highest), a net sentiment gauge at 64, an NPS score line graph, and a bar chart of negative comments over May to July.
A bar chart with three vertical bars in blue, red, and green, along with a blue line graph. To the right, four labeled boxes list goals: identify complaint causes, resolve issues, improve support teams, and enhance efficiency.

Customer Support

A collage featuring three smiling people, with two additional individuals indicated by +2. The first person has glasses and a bun, the second person has a beard, and the third person has short curly hair.

“Support CSAT scores are back up! Operations will roll out the new shipping options next month. Great work, team!”

Resolve customer issues faster than ever

Pulse helps you identify trends and patterns in customer feedback as they emerge, so you can understand issues in the context of your business, surface them to the right teams, and solve them in real time—building customer trust at every step.

Related Content

Two open business guides are displayed on a transparent background. The cover of the guide reads "Transforming your CX Strategy with Open Text Analysis". The other is the inside of this guide. Both guides contain text and graphs inside.
Young couple in a car fastening their seatbelts, demonstrating responsible driving habits. Man wearing brown jacket and woman in colorful sweater prioritizing safety before travel. Interior car shot highlighting the importance of seatbelt use and road safety awareness among young adults.
A chart with green and pink bars, accompanied by speech bubbles. One green bubble has a smiling face, while a pink bubble shows a sad face. The background is dark blue with curved lines with the text "New Alchemer Pulse" to the left

Text feedback can be overwhelming. We’ll help you cut through the noise.

FAQ

Open text analysis uses advanced machine learning to categorize and extract insights from unstructured text data like survey responses and customer feedback, helping businesses understand and act on qualitative information effectively.

Text analysis works by using algorithms and natural language processing (NLP) techniques to parse through and interpret unstructured text data. These tools identify patterns, extract key information such as sentiments or themes, and transform textual content into structured data that businesses can use to derive insights, make decisions, and improve processes.

Text analysis is important because it helps businesses extract valuable insights from unstructured text like customer feedback and reviews, uncovering trends, sentiments, and patterns to inform decisions and enhance customer experiences and products/services.

See Alchemer in action
Request a demo to learn how feedback can drive your business forward.

By accessing and using this page, you agree to the Terms of Use . Your information will never be shared.