One of the things that makes Alchemer a powerful online survey and research platform is the sheer number of question types you have access to as a user. This flexibility also allows you to add different question types to any survey, so you don’t have to choose between quantitative and qualitative questions in your survey. You can have both.
If you’re unsure of the difference between quantitative and qualitative, read the article, Does your Consumer Survey Data Paint The Whole Picture. This blog explores the differences between the two question types but here is the short version:
- Quantitative questions will tell you Who and What.
- Qualitative questions will tell you Why.
Quantitative questions are easier to measure and easier for survey takers to answer. Qualitative questions, on the other hand, are subjective and harder to measure. They are also harder for survey-takers to answer and too many can lead to survey fatigue.
Qualitative questions (like open textboxes or essay questions) are great for the exploratory phase of your research project or to delve deeper into a matter, but you want to use them sparingly. Don’t tire your survey-takers or yourself. Trying to analyze essay question answers to find a common theme can be arduous and time-consuming.
One way to make qualitative questions easier on both of you is to use Video Feedback questions, which allow people to respond with a video, rather than writing out their answers.
If you need hard statistics or quantifiable numbers, use quantitative questions. You can assign numeric values for easy, objective measurement and comparison.
Quantitative questions are close-ended which makes them easy to answer. You can ask a lot of these questions without tiring survey respondents. But you’ll want to mix up the question types to keep your survey interesting and your respondents engaged.
In this article we will explore the different ways to ask quantitative questions in your online survey.
How to Phrase Quantitative Questions
Quantitative questions typically start with how or what. Some common leading phrases include:
- How many?
- How often?
- How frequently?
- How much?
- What percentage?
- What proportion?
- To what extent?
- What is?
- What are?
Here are some quantitative question examples:
- How many text messages do you send a day?
- How frequently do you text while driving?
- How often do you send text messages while at work?
Be sure to identify all of the variables that might affect the outcome. Also be sure to include all of the groups you are interested in. Neglecting to recognize variables and groups involved will create gaps in your data that will make it hard for you to base sound decisions on.
In the example above, work and driving are variables that likely alter texting behavior. In this example, you could also collect demographic information such as age, gender, and job function so you can compare texting habits between these groups.
Quantitative Question Types
Most online survey tools offer an array of answer formats. This is good news, as these various options will engage your customers and reduce survey fatigue.
Mix up these close-ended question types to increase your response rate:
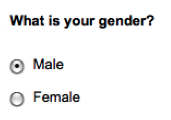
- Radio Buttons
This standard question type is the most common single-select question type. Unlike checkboxes, respondents can only choose one answer option. These are typical yes/no, true/false, either/or answer options. Perhaps you only want to know the single most important feature your customers love.
Radio Button Example:
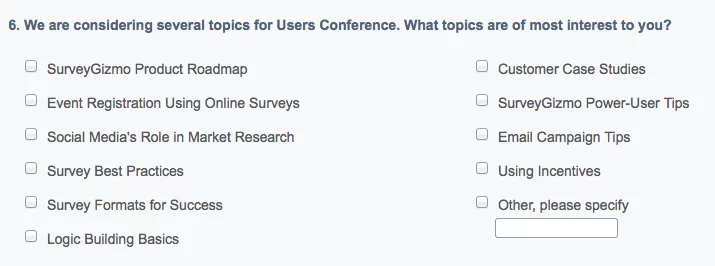
- Checkboxes
This is another old standard and is the most common multi-select answer question type. It allows respondents to select all of the answer options that apply. An example would be if you wanted to allow your customers to select all of their favorite features.Checkbox Example:
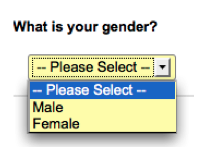
- Drop Down Menus
These can be configured to be single or multi select answer option. These are great if you have a long list of answer options but don’t want your survey to appear lengthy.
Drop Down Menu Example:
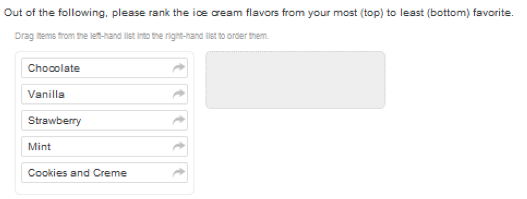
- Drag and Drop
This newer question format is very interactive. Engage your customers by allowing them to rank answer options dragging and dropping answers in the order they choose.
Drag and Drop Example:
- Likert Scale
This rating scale makes it easy for customers to rate their answer and easy for you to evaluate. The numeric reporting scale can be customized. A scale of 1-5 or 1-10 are the most popular reporting options.The answer options apppear as radio buttons.
Likert Scale Example:
- Slider Scale
The sliding scale question type can be configured as a single-select or multi-select question type. It is another great option for allowing customers to rate their response on a sliding scale. You can choose the scale and label them. These are engaging and fun.
Sliding Scale Example:
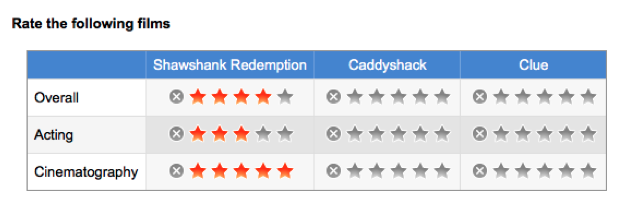
- Star Ranking
The Star Ranking question allows customers to rate criteria based on different categories defined by the row and column headers. Each star represents an equivalent numeric value and typically ranges from 1 to 5. tar ranking Is great for rating books and movie but should be used with caution as they tend to create a positive bias.
Star Ranking Example:
- NPS
The Net Promoter Score allows you to gauge customer loyalty. According to industry standards, a 0 -10 scale is used to ask customers how likely they are to recommend your product or service. A score is automatically determined based on the percentage of promoters less the percent of detractors.
Net Promoter Score Example:
- Image Select
This question type can be configured to be a single or multi-select answer option. Respondents select an image answer based on a set of set of images. This is great for your market research surveys where you would like respondents to choose which image they find most appealing.Image Select Example:
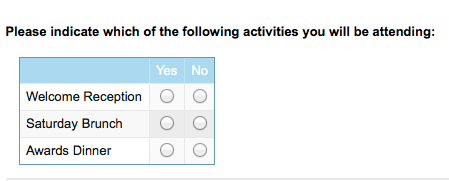
- Matrix
These tables can be configured as a single answer or multiple answer option. Columns are set up as categories with the answer options appearing in the rows. These are great for condensing your survey when categories have the same answer option. They allow you to get the answers as one question rather than setting up multiple questions.
Matrix Example:
Considerations When Choosing Quantitative Question Types
While it is nice to vary your question types to keep respondents interested, it is important to consider the reporting options. Some question types report in bar and pie charts where others may not. Always test your survey and check the reports to ensure you are collecting the data in the format that best suits your needs.
Also consider the type of device your respondents will be using. Interactive question types are engaging but may not be reliable on all mobile devices. Long matrix tables can be frustrating on a mobile device since the radio buttons or checkboxes are small. Image select questions may not render properly or take too long to load.
Use “Other” as Answer Option When Necessary
Hopefully you have considered all of the relevant answer options when crafting your quantitative question. Of course, it is now always possible to include every answer option.
If you are fearful of not including an answer option, use an “Other” answer choice and provide a textbox so respondents can specify the alternative. These are easy to setup when using a radio button or checkbox question type.
If your question is well designed, the “Other” answer option should be the exception rather than the rule. Analyzing the textbox information should not be too arduous since there are likely only a few of them. If more than 50% selected “Other “ as the answer option than perhaps you needed to do some exploratory research.
Quantifiable Results
So there you have it; 10 different quantitative question types that will keep your survey interesting and your respondents engaged. But the best part is that you will have quantifiable data that you can act on!
Related Articles:
Does You Consumer Survey Data Paint The Whole Picture: When to Use Qualitative Vs. Quantitative Research Questions
Quantitative Vs. Qualitative Research – When to Use Which
Using Qualitative Exploration To Create Quantitative Surveys
Using Highly Interactive Questions In Online Surveys

