
Cross tabulation is used to quantitatively analyze the relationship between multiple variables.
Cross tabulations — also referred to as contingency tables or crosstabs — group variables together and enable researchers to understand the correlation between the different variables. By showing how correlations change from one group of variables to another, cross tabulation allows for the identification of patterns, trends, and probabilities within data sets.
When it comes to analyzing survey response data, cross tabulation reports depict the relationship between two or more survey questions. Survey administrators are provided with a detailed comparison of how different groups of respondents answered particular questions.
Cross tabulation allows researchers to investigate data sets at a more granular level.
Survey results are typically presented in aggregate data tables that show the total responses to all questions asked in the survey. Cross tabulations are data tables that display not only the results of the entire group of respondents, but also the results from specifically defined subgroups.
For this reason, crosstabs allow researchers to closely investigate the relationships within a data set that might otherwise go unnoticed.
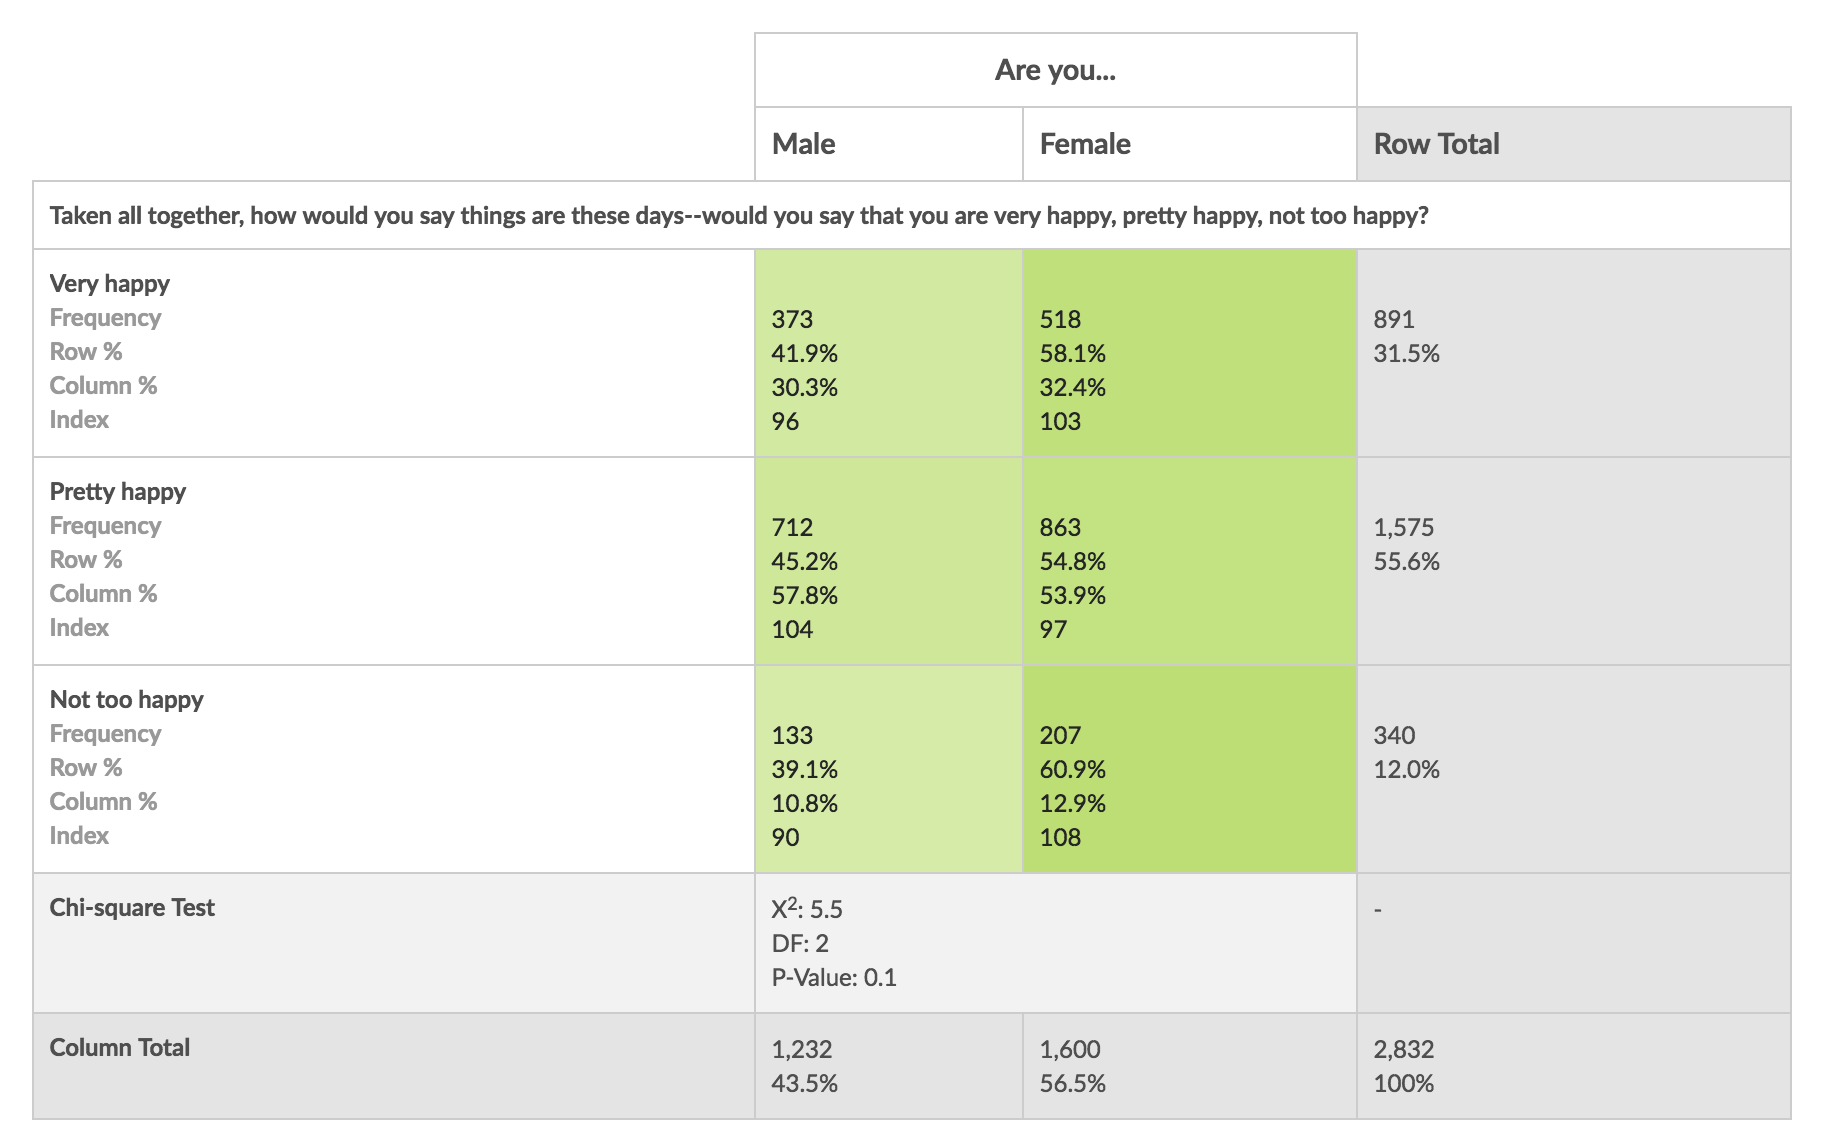
An example of a crosstab report can be found below.
Cross tabulation offers significant benefits.
Cross tabulation has become one of the most used methods for analyzing survey results, but why is it so popular?
Now that we’ve established an understanding of the purpose of cross tabulation, let’s take a look at three of the core benefits that this analytical approach provides.
#1. Cross tabulation helps to reduce confusion while analyzing data.
Large data sets can be overwhelming and confusing. Pulling insights from them to inform business decisions can often be a daunting task.
By creating crosstabs, data sets are simplified by dividing the total set into representative subgroups, which can then be interpreted at a smaller, more manageable scale.
This reduces the potential for making errors while analyzing the data, which means that time is spent efficiently.
#2. Cross tabulation allows for profound data insights.
By reducing total data sets into more manageable subgroups, cross tabulation allows researchers to yield more granular, profound insights.
The insights into the relationships between categorical variables resulting from cross tabulation would be impossible to obtain by digging into the set as a whole. This means that if crosstabs were not created, these insights would go unnoticed, or at the very least they’d require much more legwork to reveal.
#3. Insights derived from cross tabulation are actionable.
The entire purpose of performing statistical analysis on a data set is to uncover actionable insights that will then impact your end goal. These insights are able to impact business by backing up thought processes and decision-making with hard data.
Because cross tabulation simplifies complex data sets, these impactful insights are much easier to expose, record, and consider while developing overarching strategies.
Who can get the most out of the cross tabulation of survey data?
While cross tabulation is used across industries and job functions, certain personas can benefit the most from the insights provided by crosstab analysis. These personas include…
HR managers, executives, and people responsible for corporate culture
Administering surveys to employees in order to understand how they feel about a company is always a good idea for individuals responsible for the health of an organization’s culture.
These surveys provide valuable insights, especially when crosstabs from the resulting response data are analyzed.
By using cross tabulation, HR managers, executives, and others responsible for corporate culture can learn how individuals and particular departments feel about organizational culture, job satisfaction, the efficiency of interdepartmental collaboration, and general levels of morale.
Managers responsible for customer satisfaction
Customer satisfaction surveys are a valuable tool for receiving feedback on the goods and services provided by an organization.
By creating cross tabulations from the resulting response data, managers responsible for customer satisfaction are able to evaluate things like the varying levels of happiness between new and long term customers, and the likelihood that these customers would recommend the product or service to their friends or family.
Market researchers
Cross tabulation allows market researchers to draw precise, impactful insights from large data sets.
By creating crosstabs, market researchers can identify and evaluate the feelings, perspectives, and behaviors of specific subgroups of the population at large.
Market researchers can leverage cross tabulation to answer questions like, “What is the difference between teens’ and adults’ intent to purchase a particular product?”
Are you drowning in survey response data? Consider cross tabulation!