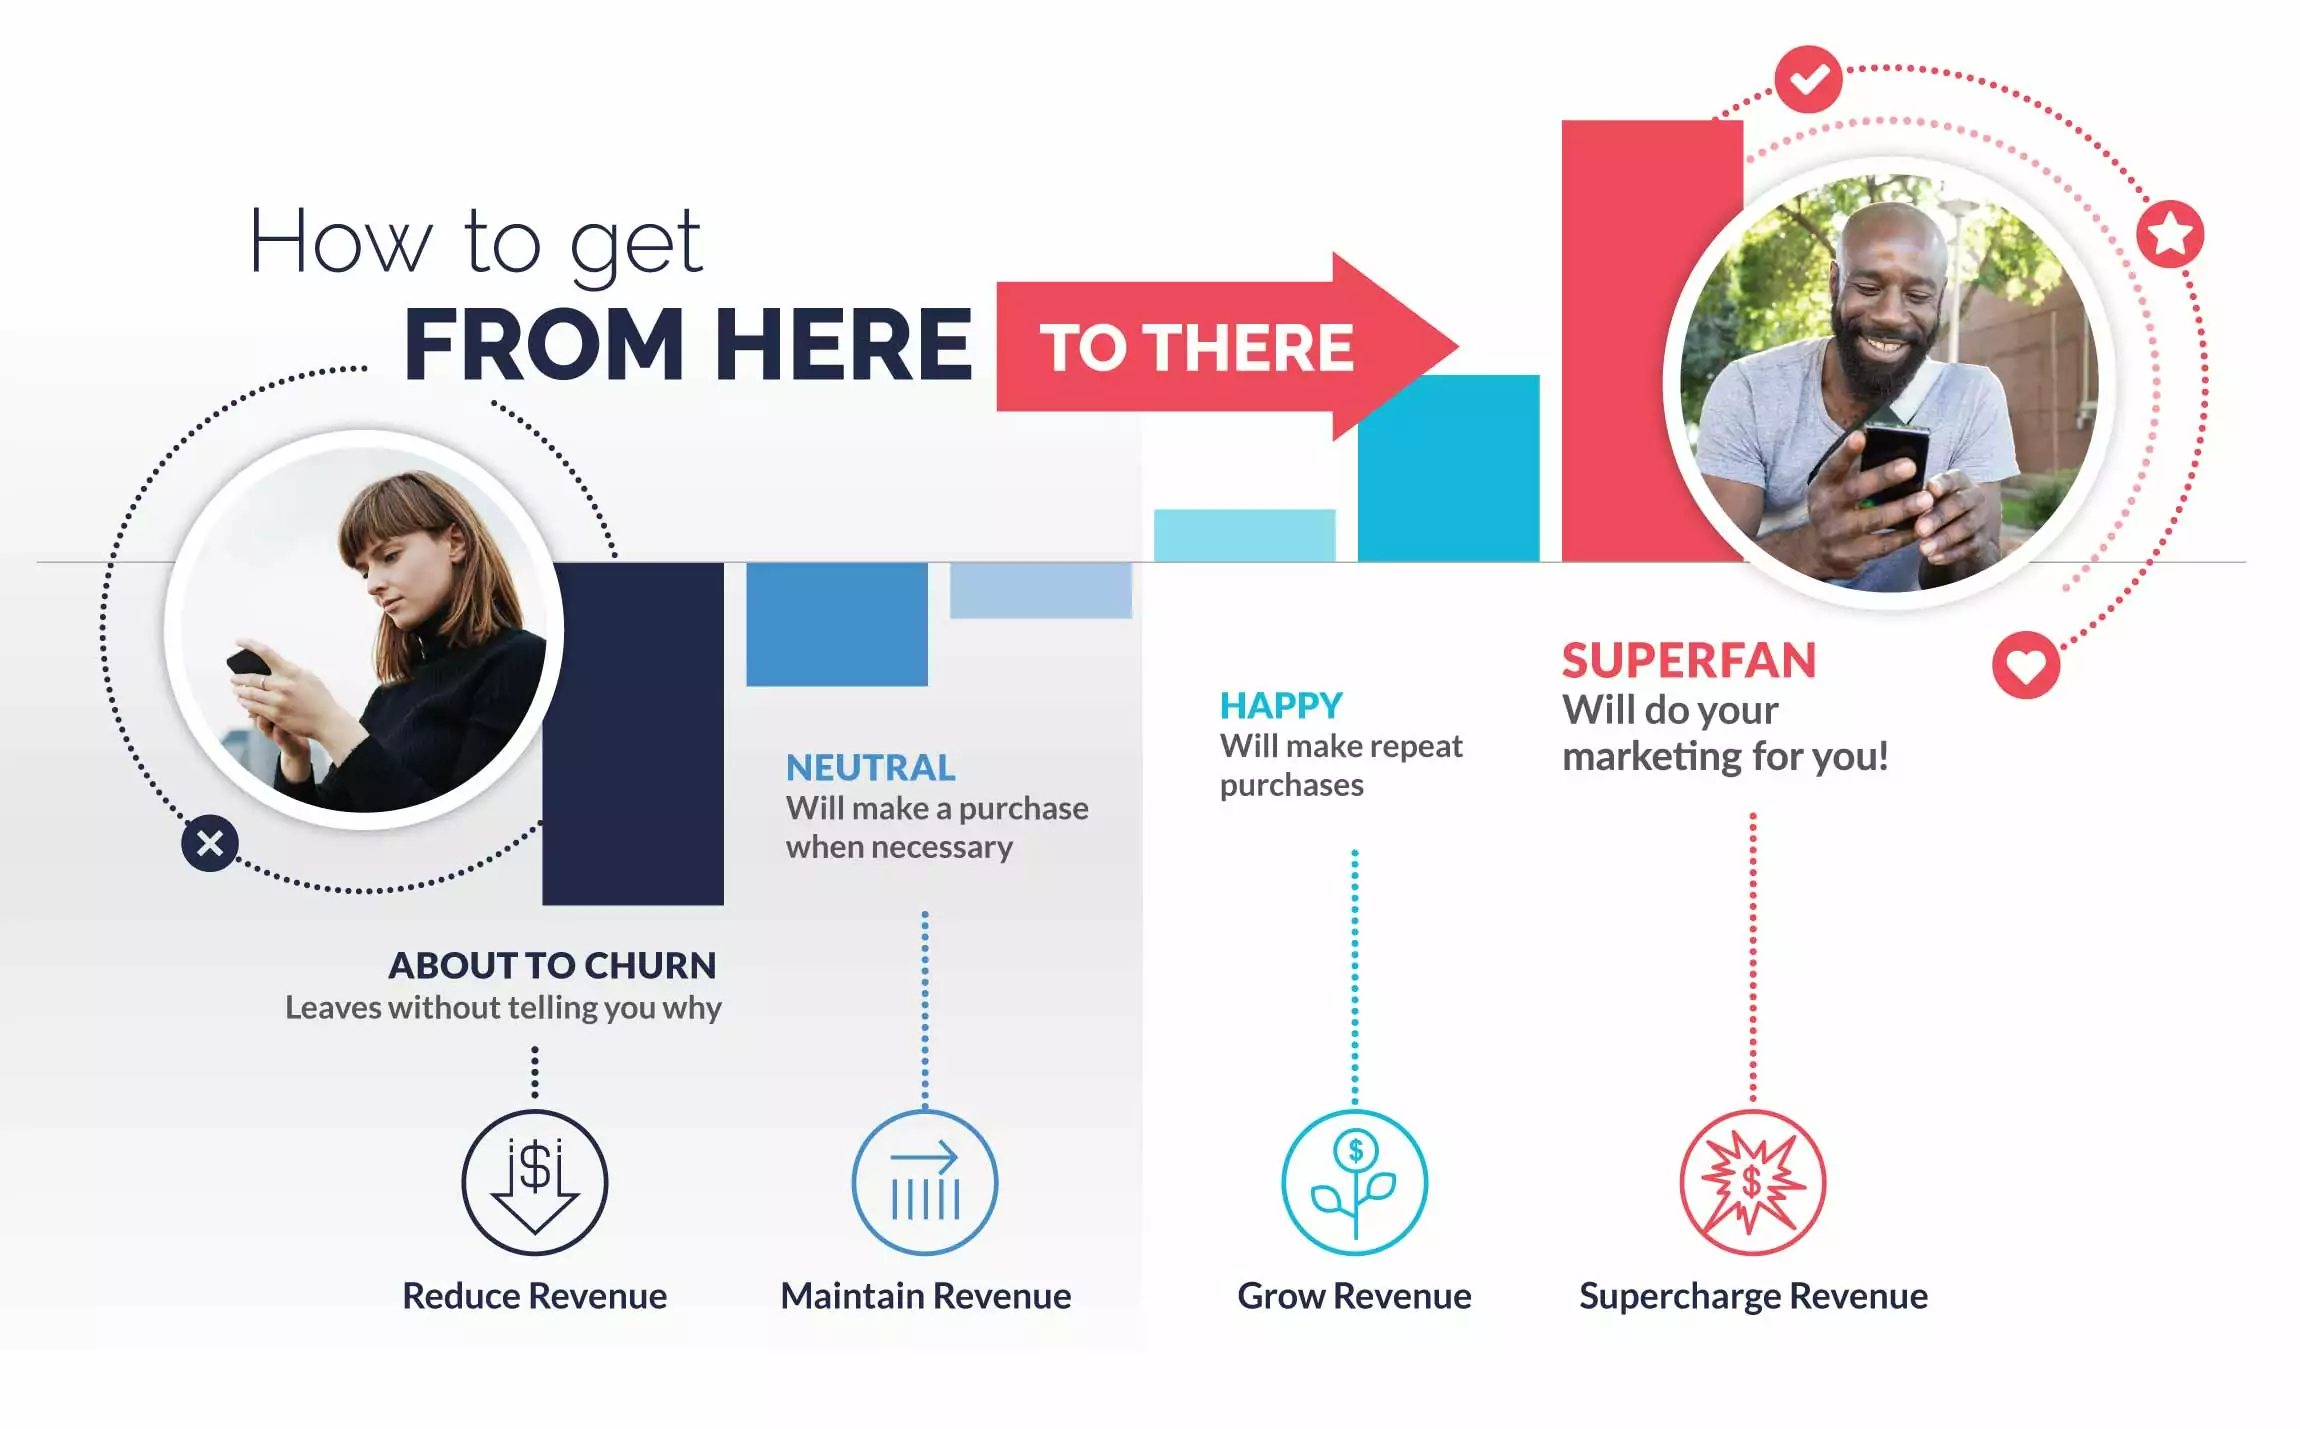
Converting customers into fans is one of your greatest opportunities for reducing churn. Consumers have no shortage of options to choose from when determining their loyalty toward brands. The key to reducing customer churn is to understand why your customers feel the way they do. Especially when their emotions change over time.
When you accurately measure shifts in customer sentiment, you can intervene at the right time before it’s too late. You can then follow up with customer segments based on how they feel and turn unhappy customers into promoters by acting on their feedback.
But before you do any of this, there are four metrics to analyze:
- Current Customer Churn Rate
- Customer Lifetime Value (CLTV)
- Customer Acquisition Cost (CAC)
- Customer Effort Score
Let’s take a look at each.
1. Calculate your current customer churn rate
You can’t improve if you don’t know your baseline.
The first step to reducing customer churn is to understand your starting point, which means measuring your existing churn rate.
We’ll use annual churn as an example. Here’s the calculation:
Depending on your business and customer volume, you may need to calculate churn monthly, quarterly, or annually. For example, if you have thousands of customers, you’ll probably want to calculate churn more frequently than you would if you only had a few dozen.
Pro tip: Although customer churn and customer retention tell us similar information, they are different metrics and should be treated as such. Retention measures how well you keep customers while churn looks at the customers you’ve lost over time. See this practical guide that outlines differences between calculating churn and retention.
2. Measure Customer Lifetime Value (CLTV)
CLTV tells you not only how much each new customer is worth, but also how much you can pay to acquire that customer.
A clear understanding of this robust metric can serve many purposes. CLTV is an indicator of your app’s success, a reminder of the sheer power of customer loyalty, and a tool for forecasting growth. But at its simplest, CLTV is what drives your mobile marketing budget. It tells you not only how much each new customer is worth, but also how much you can pay to acquire that customer.
When evaluating the health of their mobile apps, many marketers automatically turn toward Average Revenue Per User (ARPU) and Cost Per Install (CPI). But while it may be common practice, relying on these two metrics alone provides just one side of the picture. What’s missing is a holistic understanding of the customer.
CLTV is a simple yet powerful heuristic for assigning a dollar value to both the tangible and intangible value a customer contributes to the health of your mobile app over the duration of their time with your app (“lifetime”). The tangible comes down to what we already know: Average Revenue Per User and Cost Per Install. The intangible dives deep within the customer journey to extend the definition of value beyond its monetary connotation. Factoring in the intangibles of customer loyalty, satisfaction, engagement, and retention, LTV provides a truer assessment of how much a customer relationship is worth to your app.
How it’s done: Customer lifetime value can be broken down into three categories of variables: Monetization, Retention, and Virality. While there are several different ways of further breaking down these variables (and of course, each business defines Monetization, Retention, and Virality differently), we recommend using this model as a starting point for turning these variables into a concrete formula.
3. Determine your Customer Acquisition Cost (CAC)
Success or failure often comes down to knowing your numbers.
As long as the Average Customer Lifetime Value (CLTV) exceeds the Customer Acquisition Cost (CAC), your marketing expenditures will have a positive return on investment. The rule, then, becomes continue to invest in marketing if and only if your returns are positive.
In the world of mobile apps, customer acquisition almost always comes down to the Cost Per Install (CPI). This is calculated by dividing the amount spent on advertising by the number of new customers attributed to that specific campaign.
If it costs less to acquire one customer (one install) than the amount of revenue that customer will likely generate, then advertise away. If not (as is often the case in a surprising number of app categories), you’ll need to first find a way to boost retention, increase ARPU, or grow referrals to rebalance the equation before it makes economic sense to invest in app install ads.
Take a deeper dive: Hubspot released a comprehensive guide for calculating, understanding, and improving CAC in 2020. If you are new to CAC, start there.
4. Calculate your Customer Effort Score
Is your offering really worth the effort?
No matter how amazing your product or service is, customers won’t stick around if it’s too difficult to engage. No matter your industry, competitors are out there — if your product is too challenging, your customers have options.
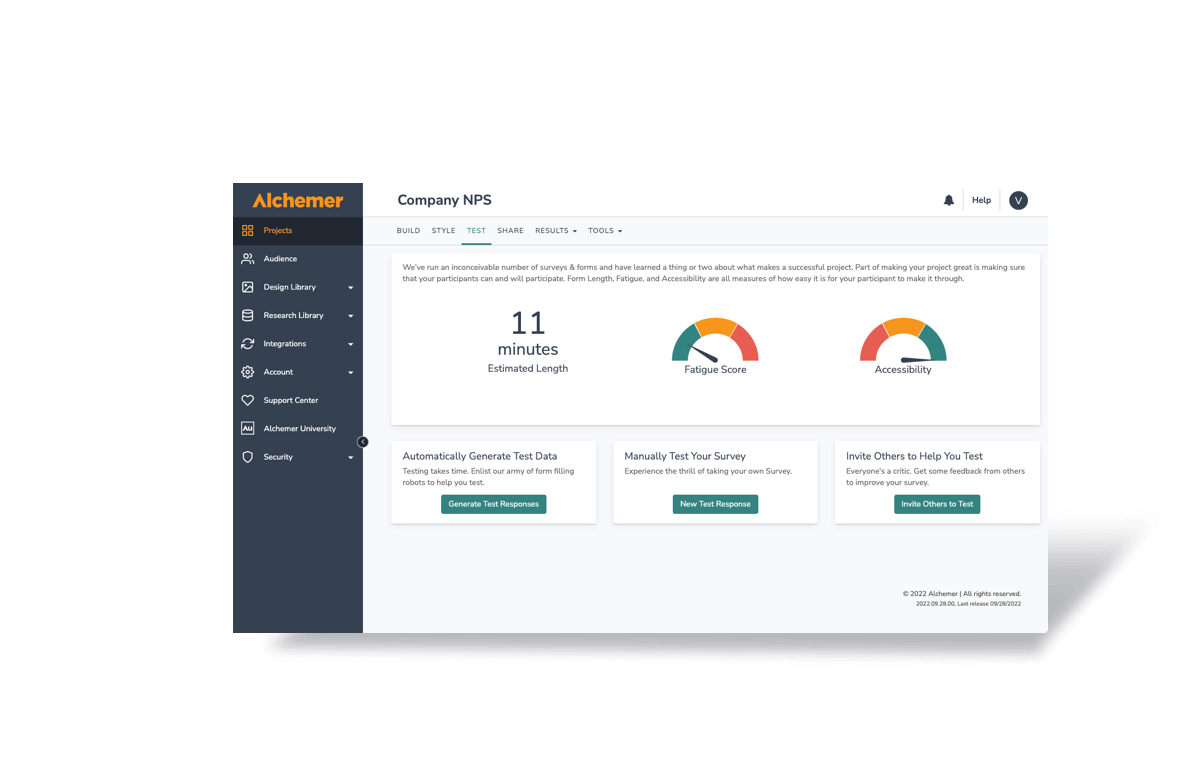
Customer Effort Score is a catch-all phrase to help you understand how difficult it is for customers to interact with your product or service (e.g. making a purchase, solving a problem with customer support, signing up, etc.). There are various metrics to consider when measuring customer effort depending on your business and mobile experience, including survey responses like NPS, a Likert scale, emotion faces, and more. But however you decide to measure customer feedback, the goal is to get to the heart of what makes your offering easy or difficult to use.
Measuring customer effort is a part of your customer relationship foundation, but it’s not a silver bullet. For instance, customer effort scores may help you predict future purchase behavior and how likely a customer is to refer your brand to others, but it does not give you insight into the relationship the customer has with your brand.
Give it a try: Just like there is no singular way to measure customer satisfaction, there is no singular way to measure customer effort. Many companies measure effort by surveying customers in different ways. Alchemer Mobile (formerly Apptentive) recommends starting with a simple yes/no question like, “Do you love our company?” and from there, giving customers various ways to share feedback based on their response.
Conclusion
Even in the best of times, average mobile customer retention isn’t great. According to research from Appsflyer, MixPanel, and Localytics, average 90-day retention for mobile apps across categories is only between 20-30 percent, leaving lots of room for improvement. Alchemer Mobile (formerly Apptentive)’s data tells a slightly different story: In the second half of 2019, our customer base saw 43 percent of new consumers across apps stay active.
In order to boost customer retention, it’s critical to watch for negative shifts in emotion. When you quickly identify at-risk consumers, you can intervene before it’s too late by retargeting them or redirecting their frustration into valuable feedback. Let Alchemer Mobile (formerly Apptentive) help get you where you want to be.


