Healthcare App Subcategories: Medical, Fitness, Health Insurance
In our 2022 Mobile Customer Engagement Benchmark Report, a study of more than 1,000 apps across a billion mobile app installs, we take a close look at apps in the Healthcare category. Healthcare apps are divided into three subcategories: Medical (public health, condition management, reproductive services, etc.) and Fitness (fitness tracking, nutrition, workout plans, etc.), and Health Insurance.
“Regardless of what happens with the pandemic next year, the shift to virtual care and care-at-home will continue to accelerate. Beyond telehealth visits, 2022 will see increased adoption of hospital-at-home and remote patient management.” – Milan Shah, CTO, Biofourmis
After a major MAU uptick in 2020 due to pandemic-driven lockdowns, many consumers continued their activity in mobile apps in order to manage care in 2021. Due to ease of use, people getting into a groove of at-home fitness, and quick access to information on the go, consumers stuck around, and Healthcare brands saw improved retention and engagement opportunities throughout the year.

Data included:
- Ratings and reviews
- Retention
- Interaction and response rates
- Surveys
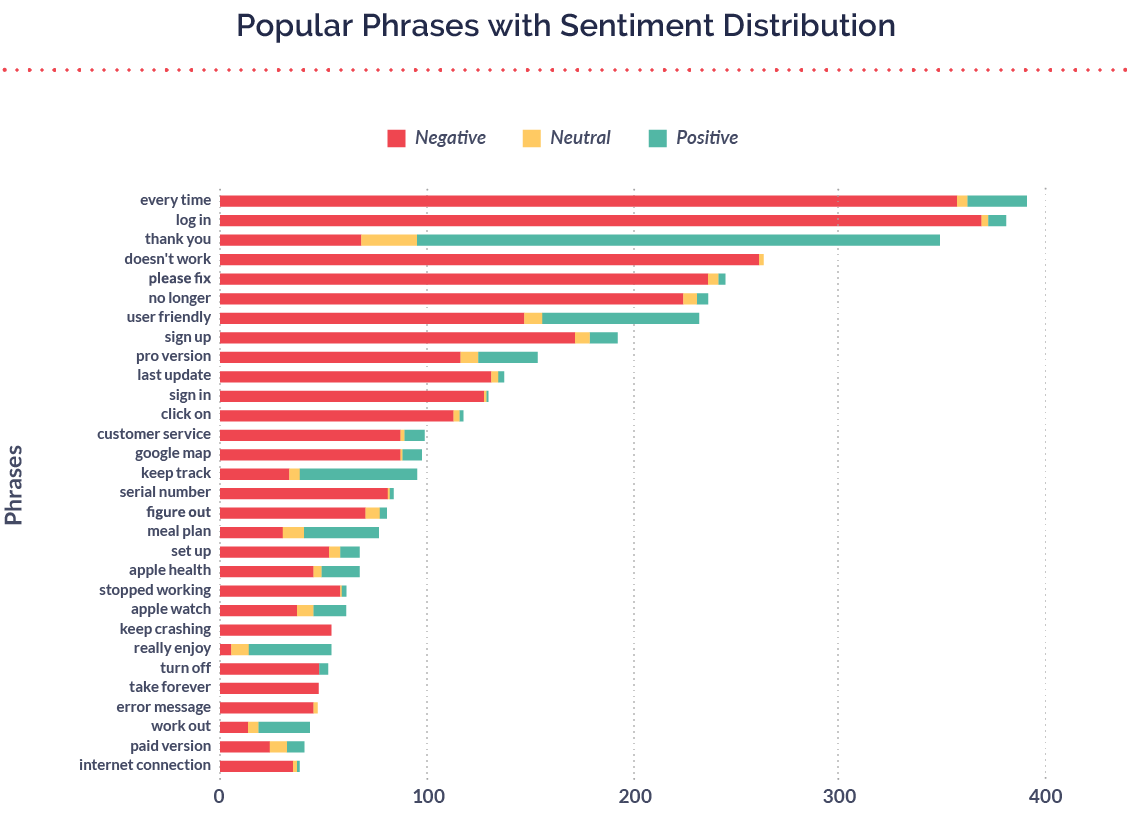
- Popular phrases
- Popular phrases with sentiment distribution
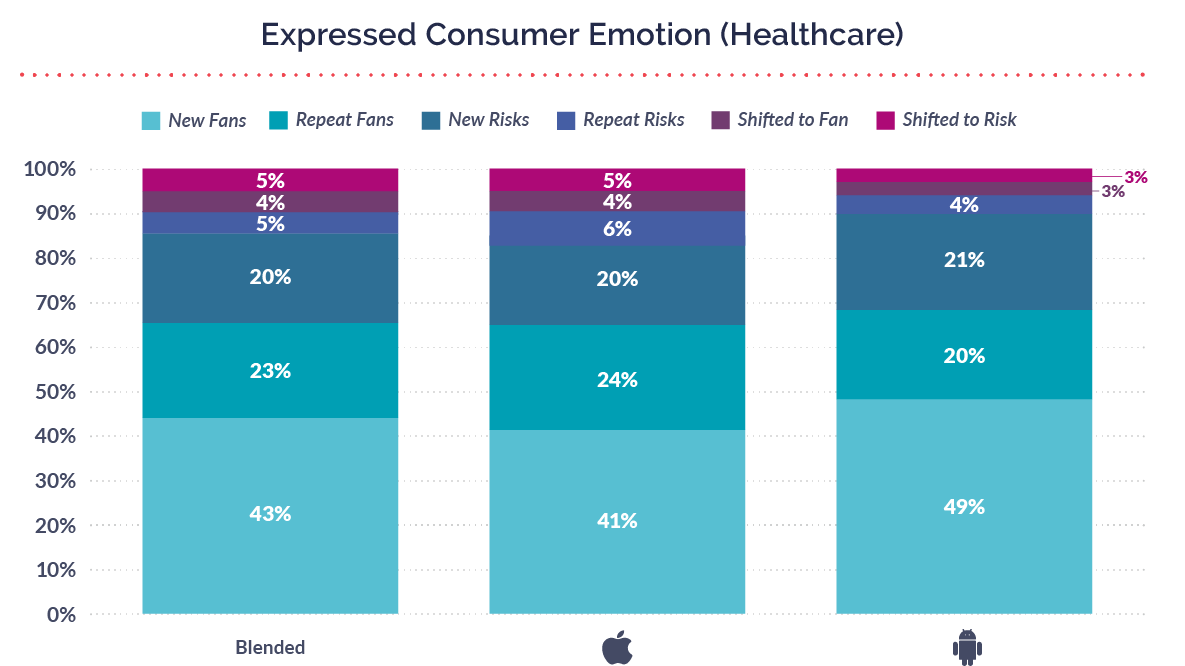
- Consumer sentiment
- Expressed customer emotion
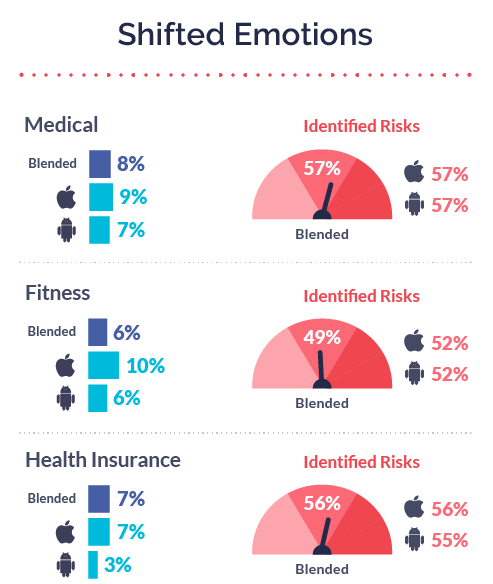
- Shifted emotions
- Expressed consumer sentiment by subcategory
- Shifted emotions by subcategory
- Retention rates for Fans and Risks
→DOWNLOAD THE FULL 2022 BENCHMARK REPORT HERE
Summary of Healthcare Apps in 2021
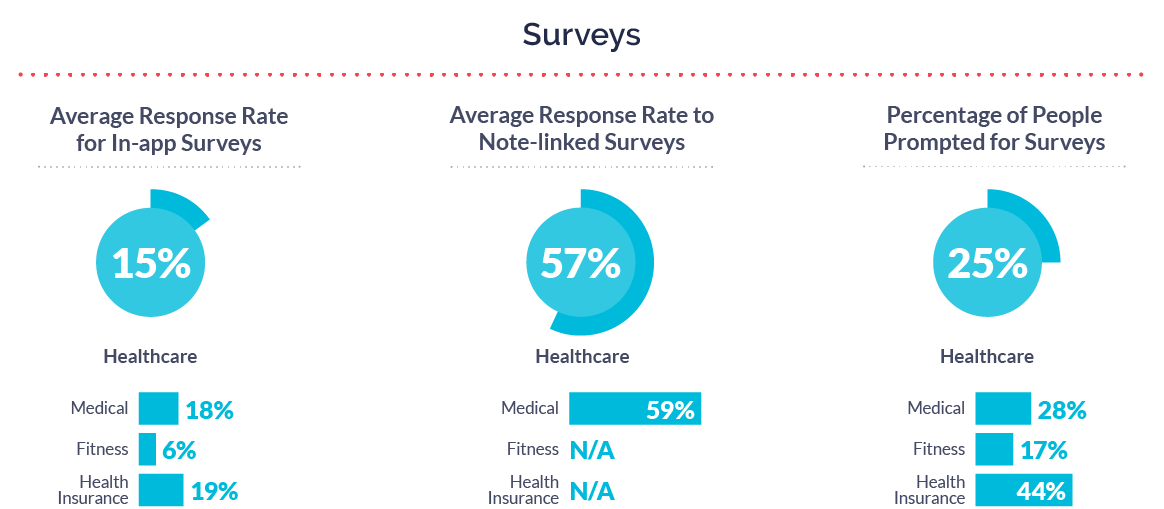
To start, Healthcare mobile teams asked more consumers for their feedback in 2021 than in previous years. The percentage of people prompted for surveys was 28% in Medical, 17% in Fitness, and an extremely high 44% in Health Insurance (28% overall). When brands proactively ask for feedback, they’re able to get ahead of unhappiness and churn, and mobile surveys are a great way to broaden your customer voice. Response rates were high in Medical at 18% and Health Insurance at 19% (13% overall), but fell short in Fitness at 6%.
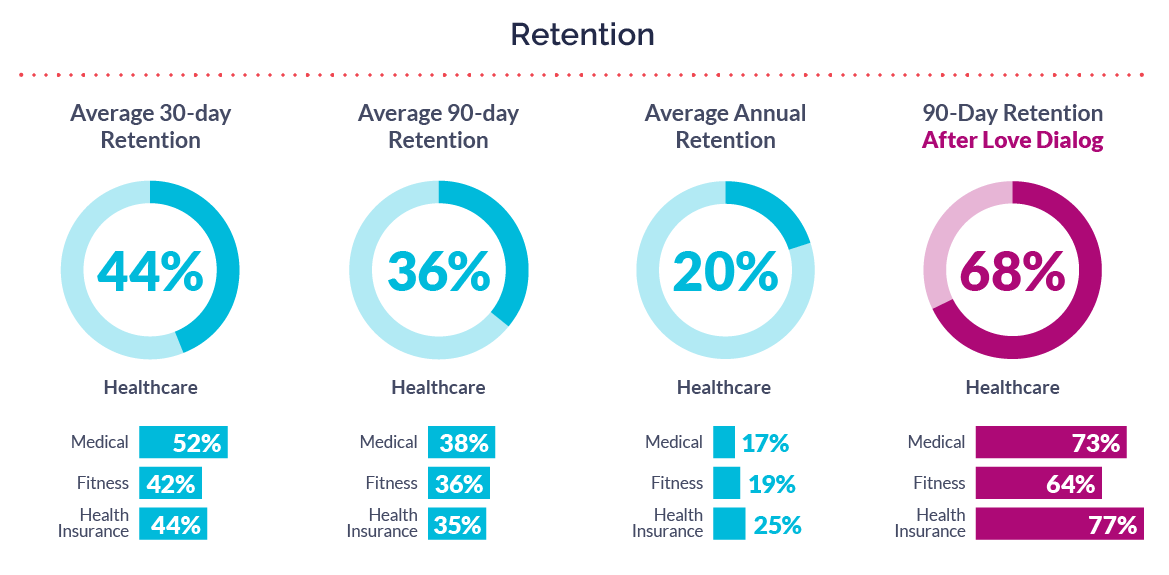
While retention in Healthcare was lower than overall benchmarks, there were year-over-year improvements. Collective average 30-day retention was 44% (67% overall), 90-day was 36% (58% overall), and annual was 20% (44% overall). However, these numbers are improvements from 2020, especially in annual retention which saw a 25% year-over-year gain. When brands showed consumers the Love Dialog, benchmarks improved: 90-day retention increased to 68% after seeing the Love Dialog (79% overall).
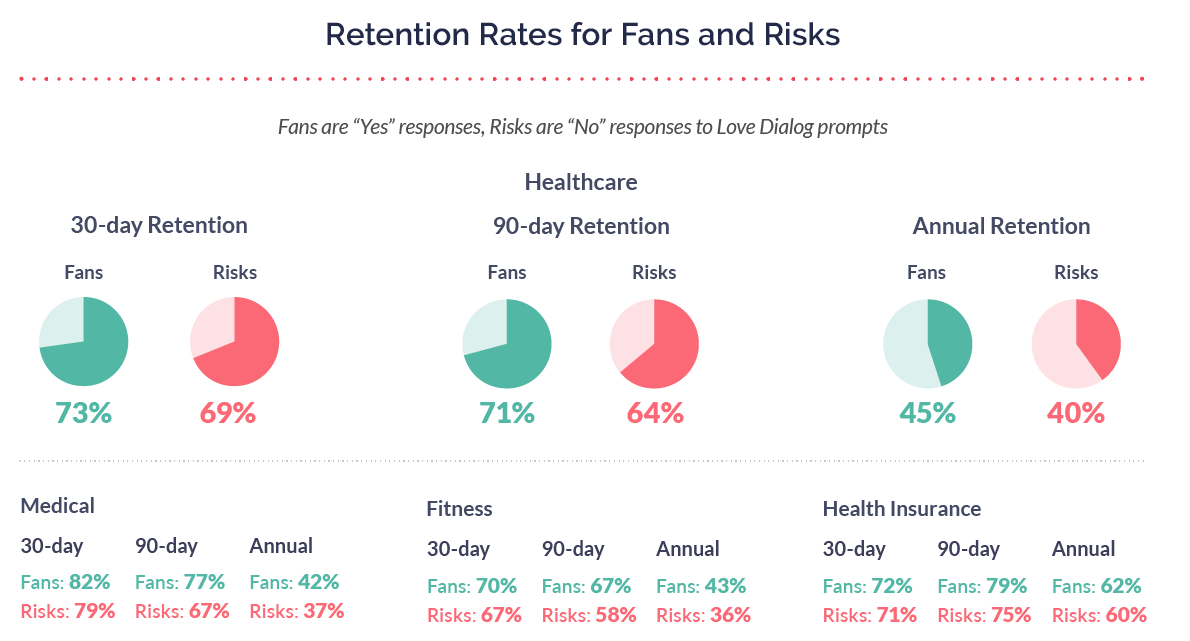
Typically, brands see retention decrease as time goes on, but that’s not always the case. For retention for Fans versus Risks in the Health Insurance subcategory, retention was actually greater at 90 days than it was at 30 days. This can happen in industries where consumers don’t engage at a frequent cadence. In Health Insurance, many people don’t use their health insurance monthly, which leads to longer gaps of time between opening the app. If brands in this category consider success by single-day or 30-day retention alone, they likely aren’t capturing the big picture of how consumers utilize their apps.
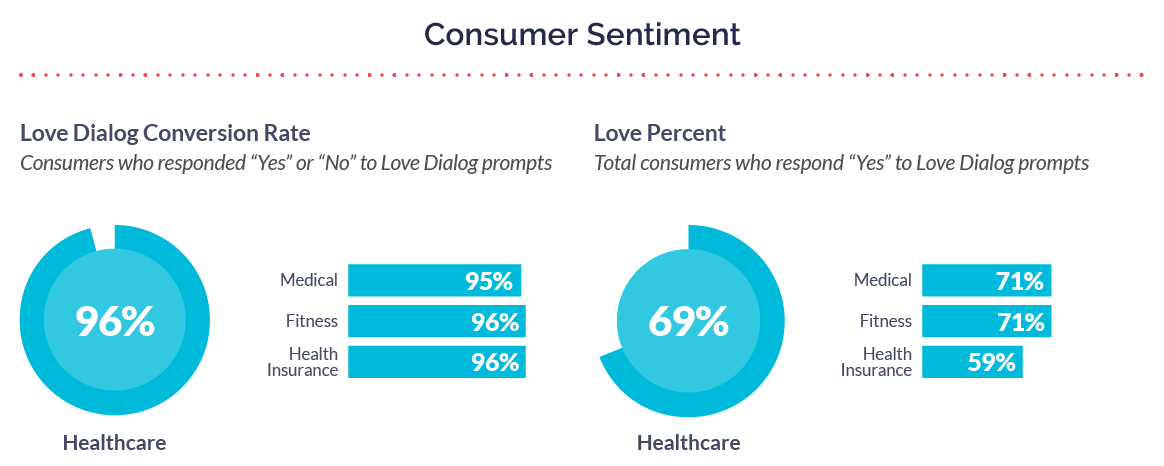
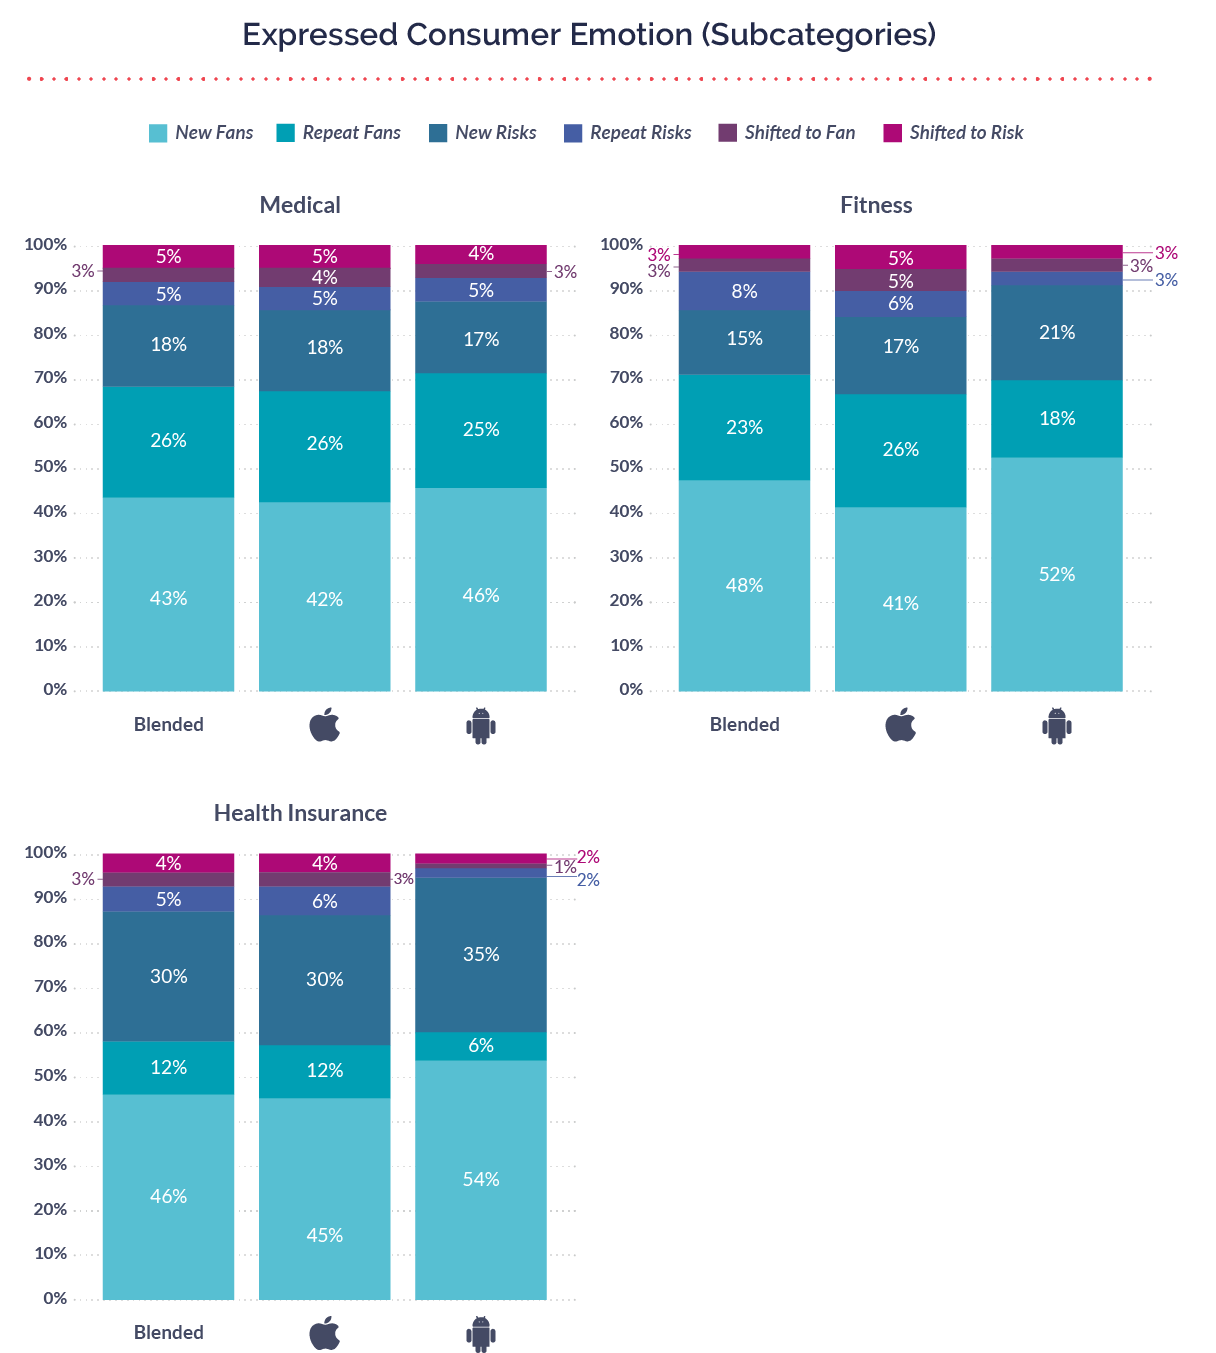
Consumer happiness matched what was seen in retention. Medical and Fitness apps both had a Love Percent of 75%, higher than the overall average of 64%. Health Insurance was slightly lower at 59%, still showing that the majority of consumers were happy with their mobile brand experiences. In 2022, Healthcare brands should continue leveraging their mobile apps to target Fan and Risk segments for feedback, while acting on what they learn and closing the feedback loop when changes are made.

Additional reading and resources
- 6 Ways Healthcare Apps Have Changed the Medical Industry
- Best Practices for Healthcare App Development and Telemedicine Apps
- Mobile App Ratings and Reviews: 2022 Benchmarks
- Strava’s Missed Opportunity to Drive Mobile App Retention and Gain Actionable Product Feedback
Want to see how the Healthcare category compares to the macro trends we identified in our 2022 Mobile Customer Engagement Report? Download your copy here.

