
Brands in the Business Services category faced diverse 2020 challenges. Some companies (like those focused on work collaboration or expense management) faced hurdles early on in the year that flattened as employees became more comfortable working from home. Brands focused on shipping faced challenges with cadences parallel to the impacts on local and national supply chains. Others (like brands in security and monitoring) faced few new challenges outside of their regular business patterns.
In our 2021 Mobile App Engagement Benchmark Report, a study of 1,000 apps across a billion+ app installs, we take a close look at apps in the Business Services category.
Below is a summary of our research specifically on Business Services apps. Read on for data-supported benchmarks Business apps should focus on in 2021 and beyond based on what was learned from a year like no other.
2021 Engagement Benchmarks for Business Services Apps
There were two engagement commonalities in Business Services apps: first were the ways consumers behaved within their apps, and second were the ways they felt about their mobile experiences.
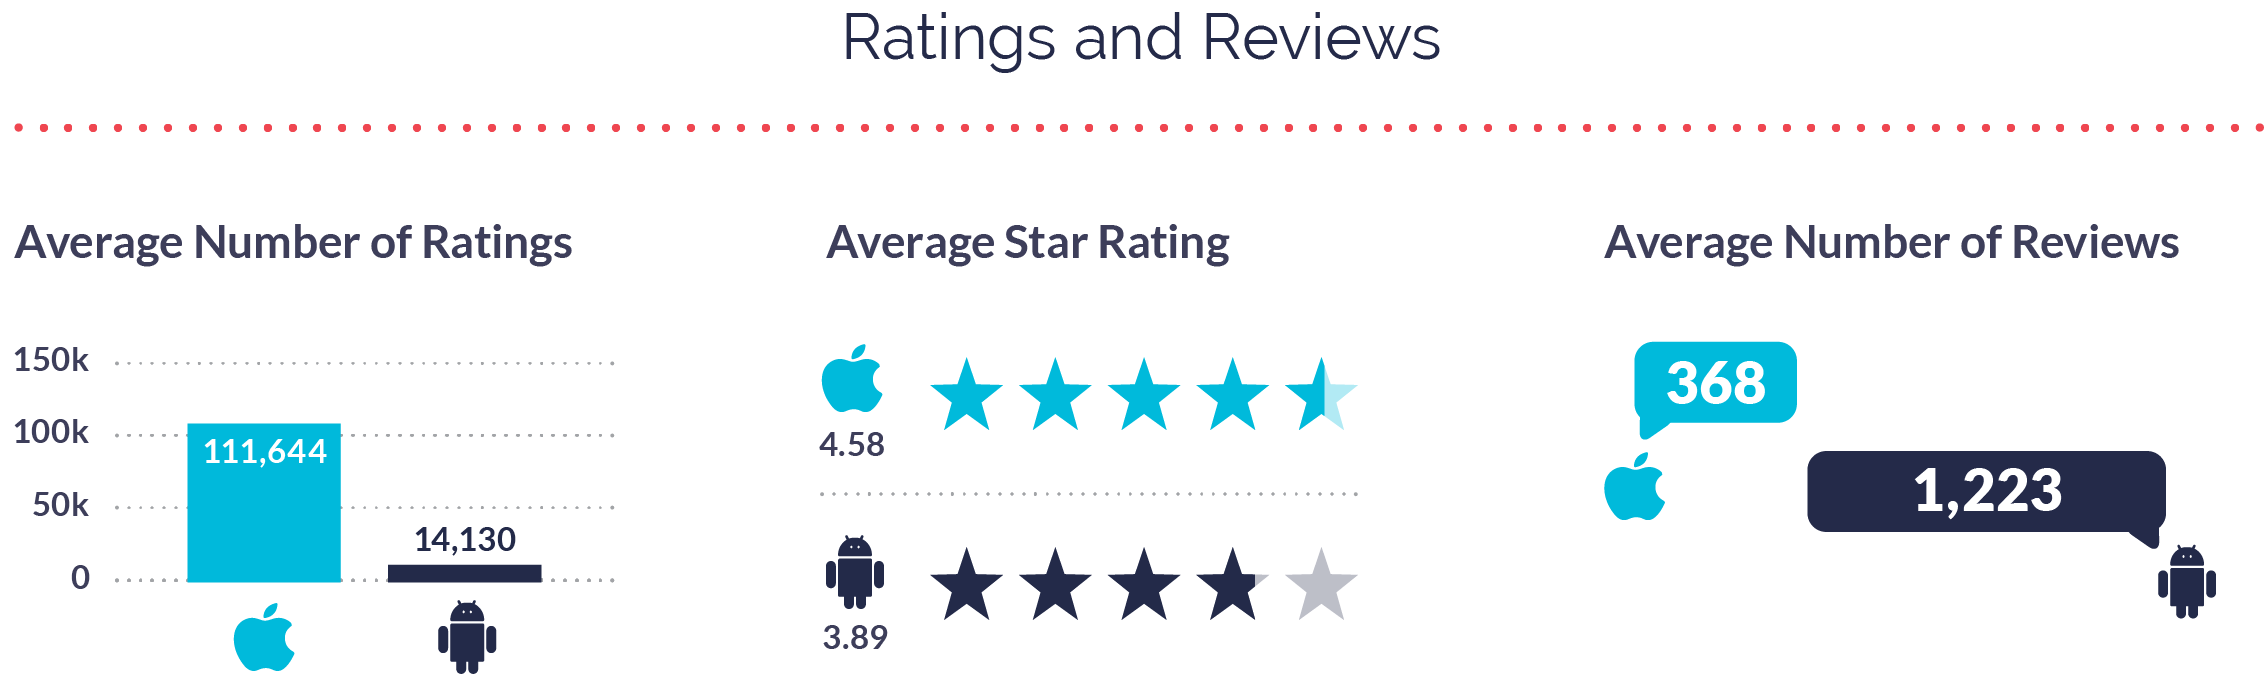
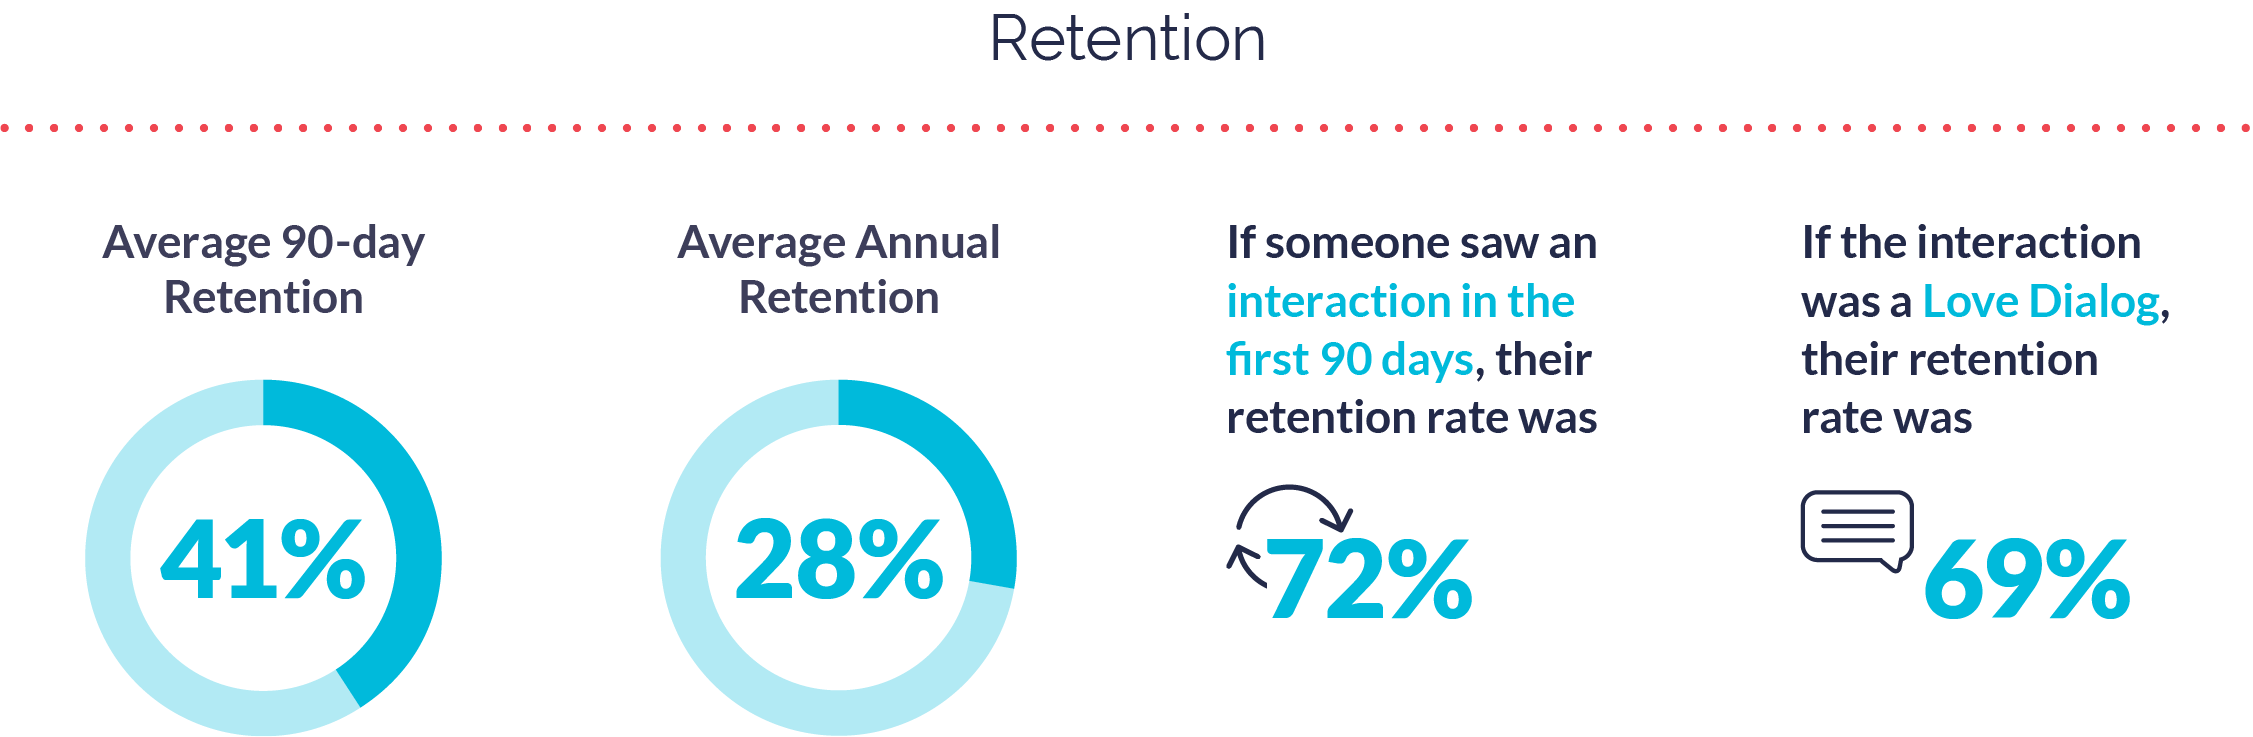
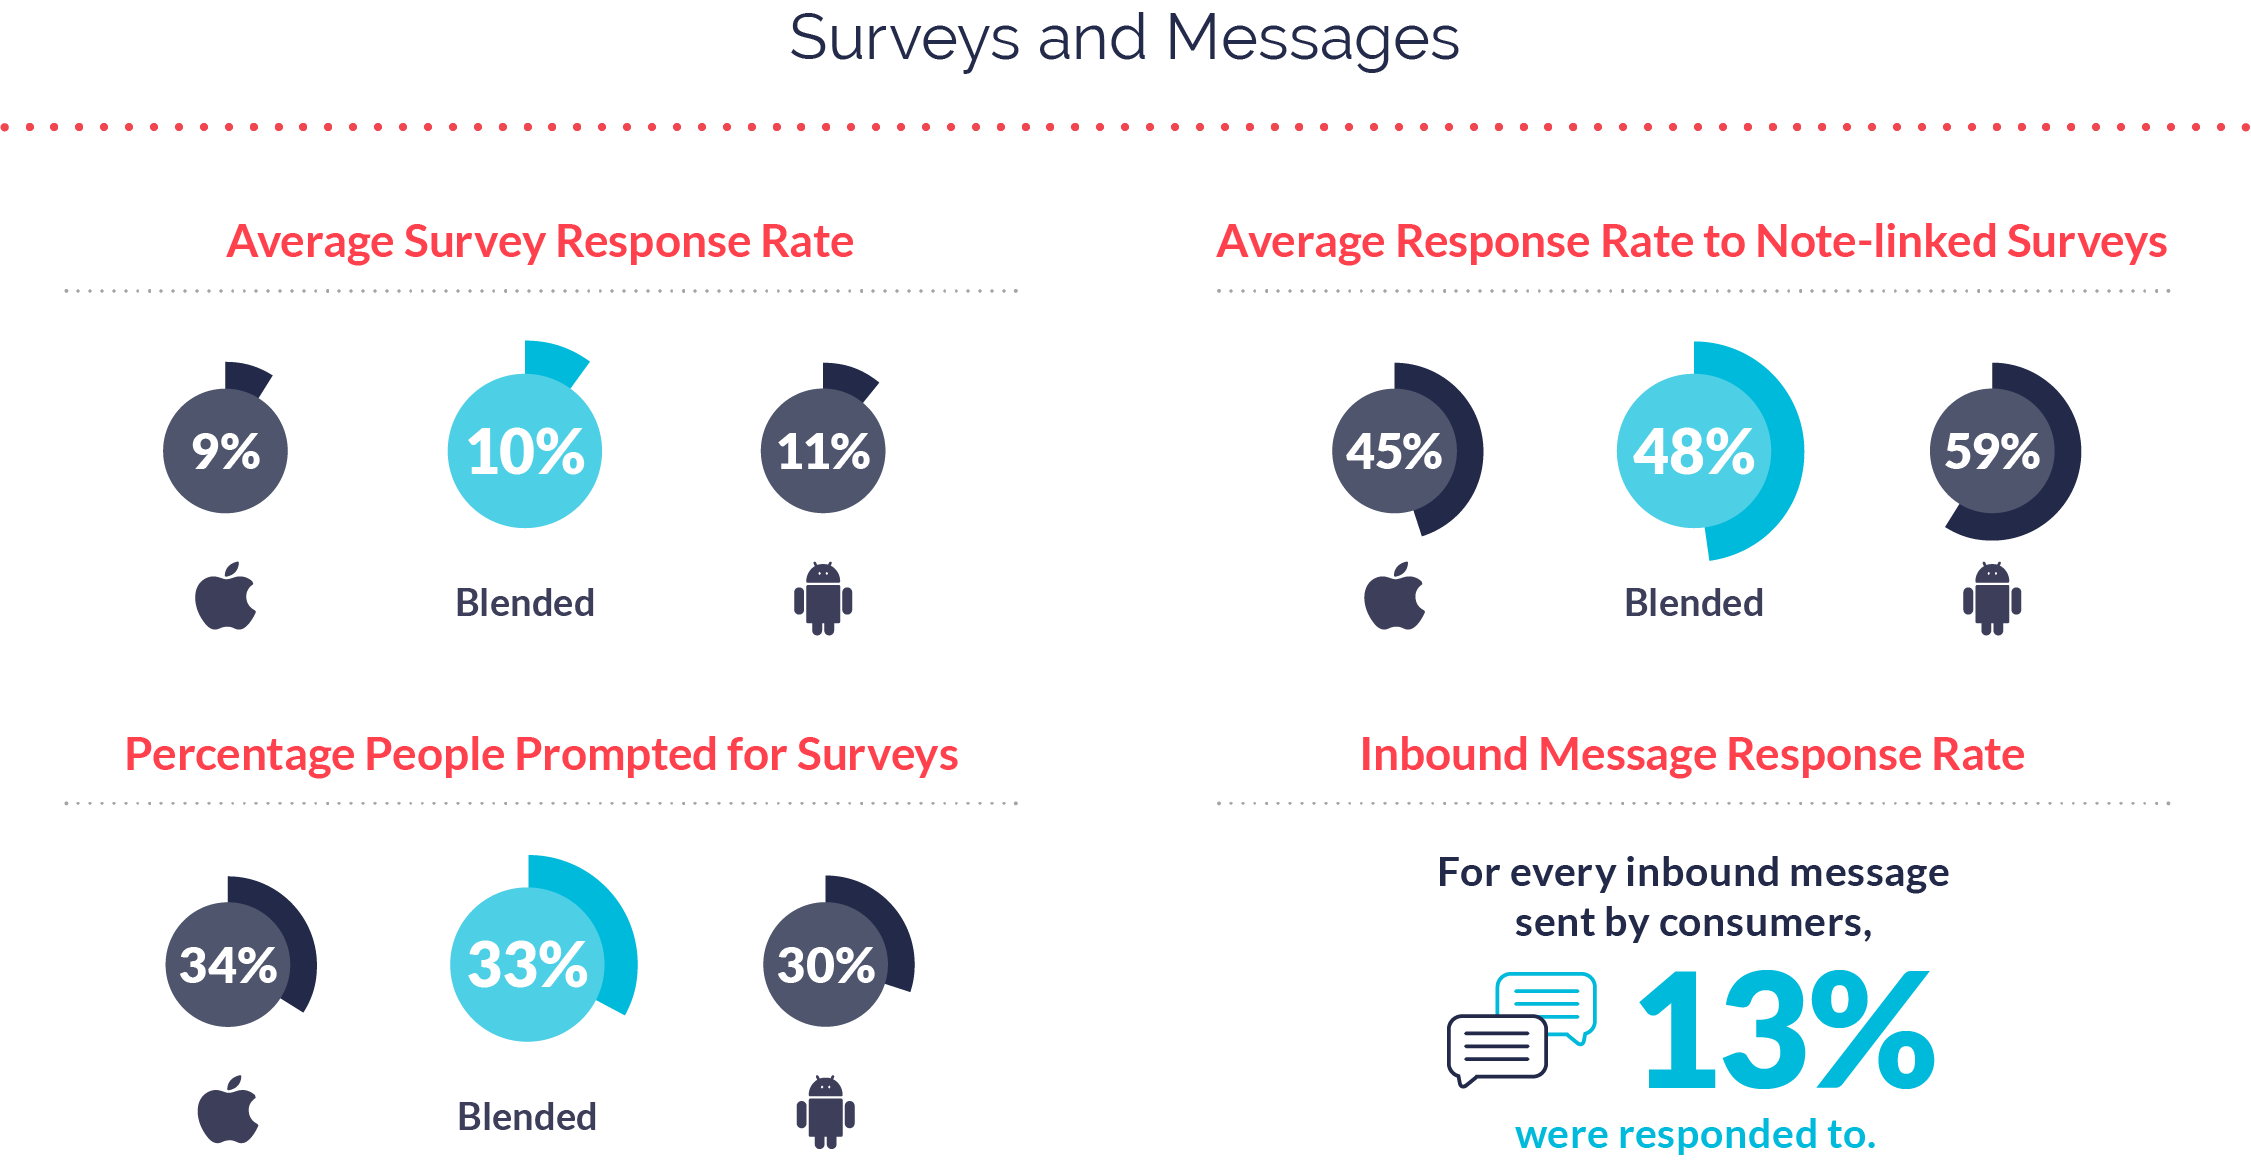
Luckily, Business Services benchmarks closely matched macro averages across the board, including app store ratings, retention, interaction rate, response rate, Love Percent, and expressed sentiment.
The engagement benchmark where Business Services apps fell slightly below average was annual retention, where they averaged 52% for Fans (average is 54%) and 46% for Risks (average is 50%). Factors affecting these low retention rates could include ease of use, ability to easily switch to competitors, or budget cuts to finance consumer usage.
In 2021, Business Services apps should revisit the percentage of consumers they prompt for feedback and where they ask for it along consumer journeys in order to improve short and long-term retention.
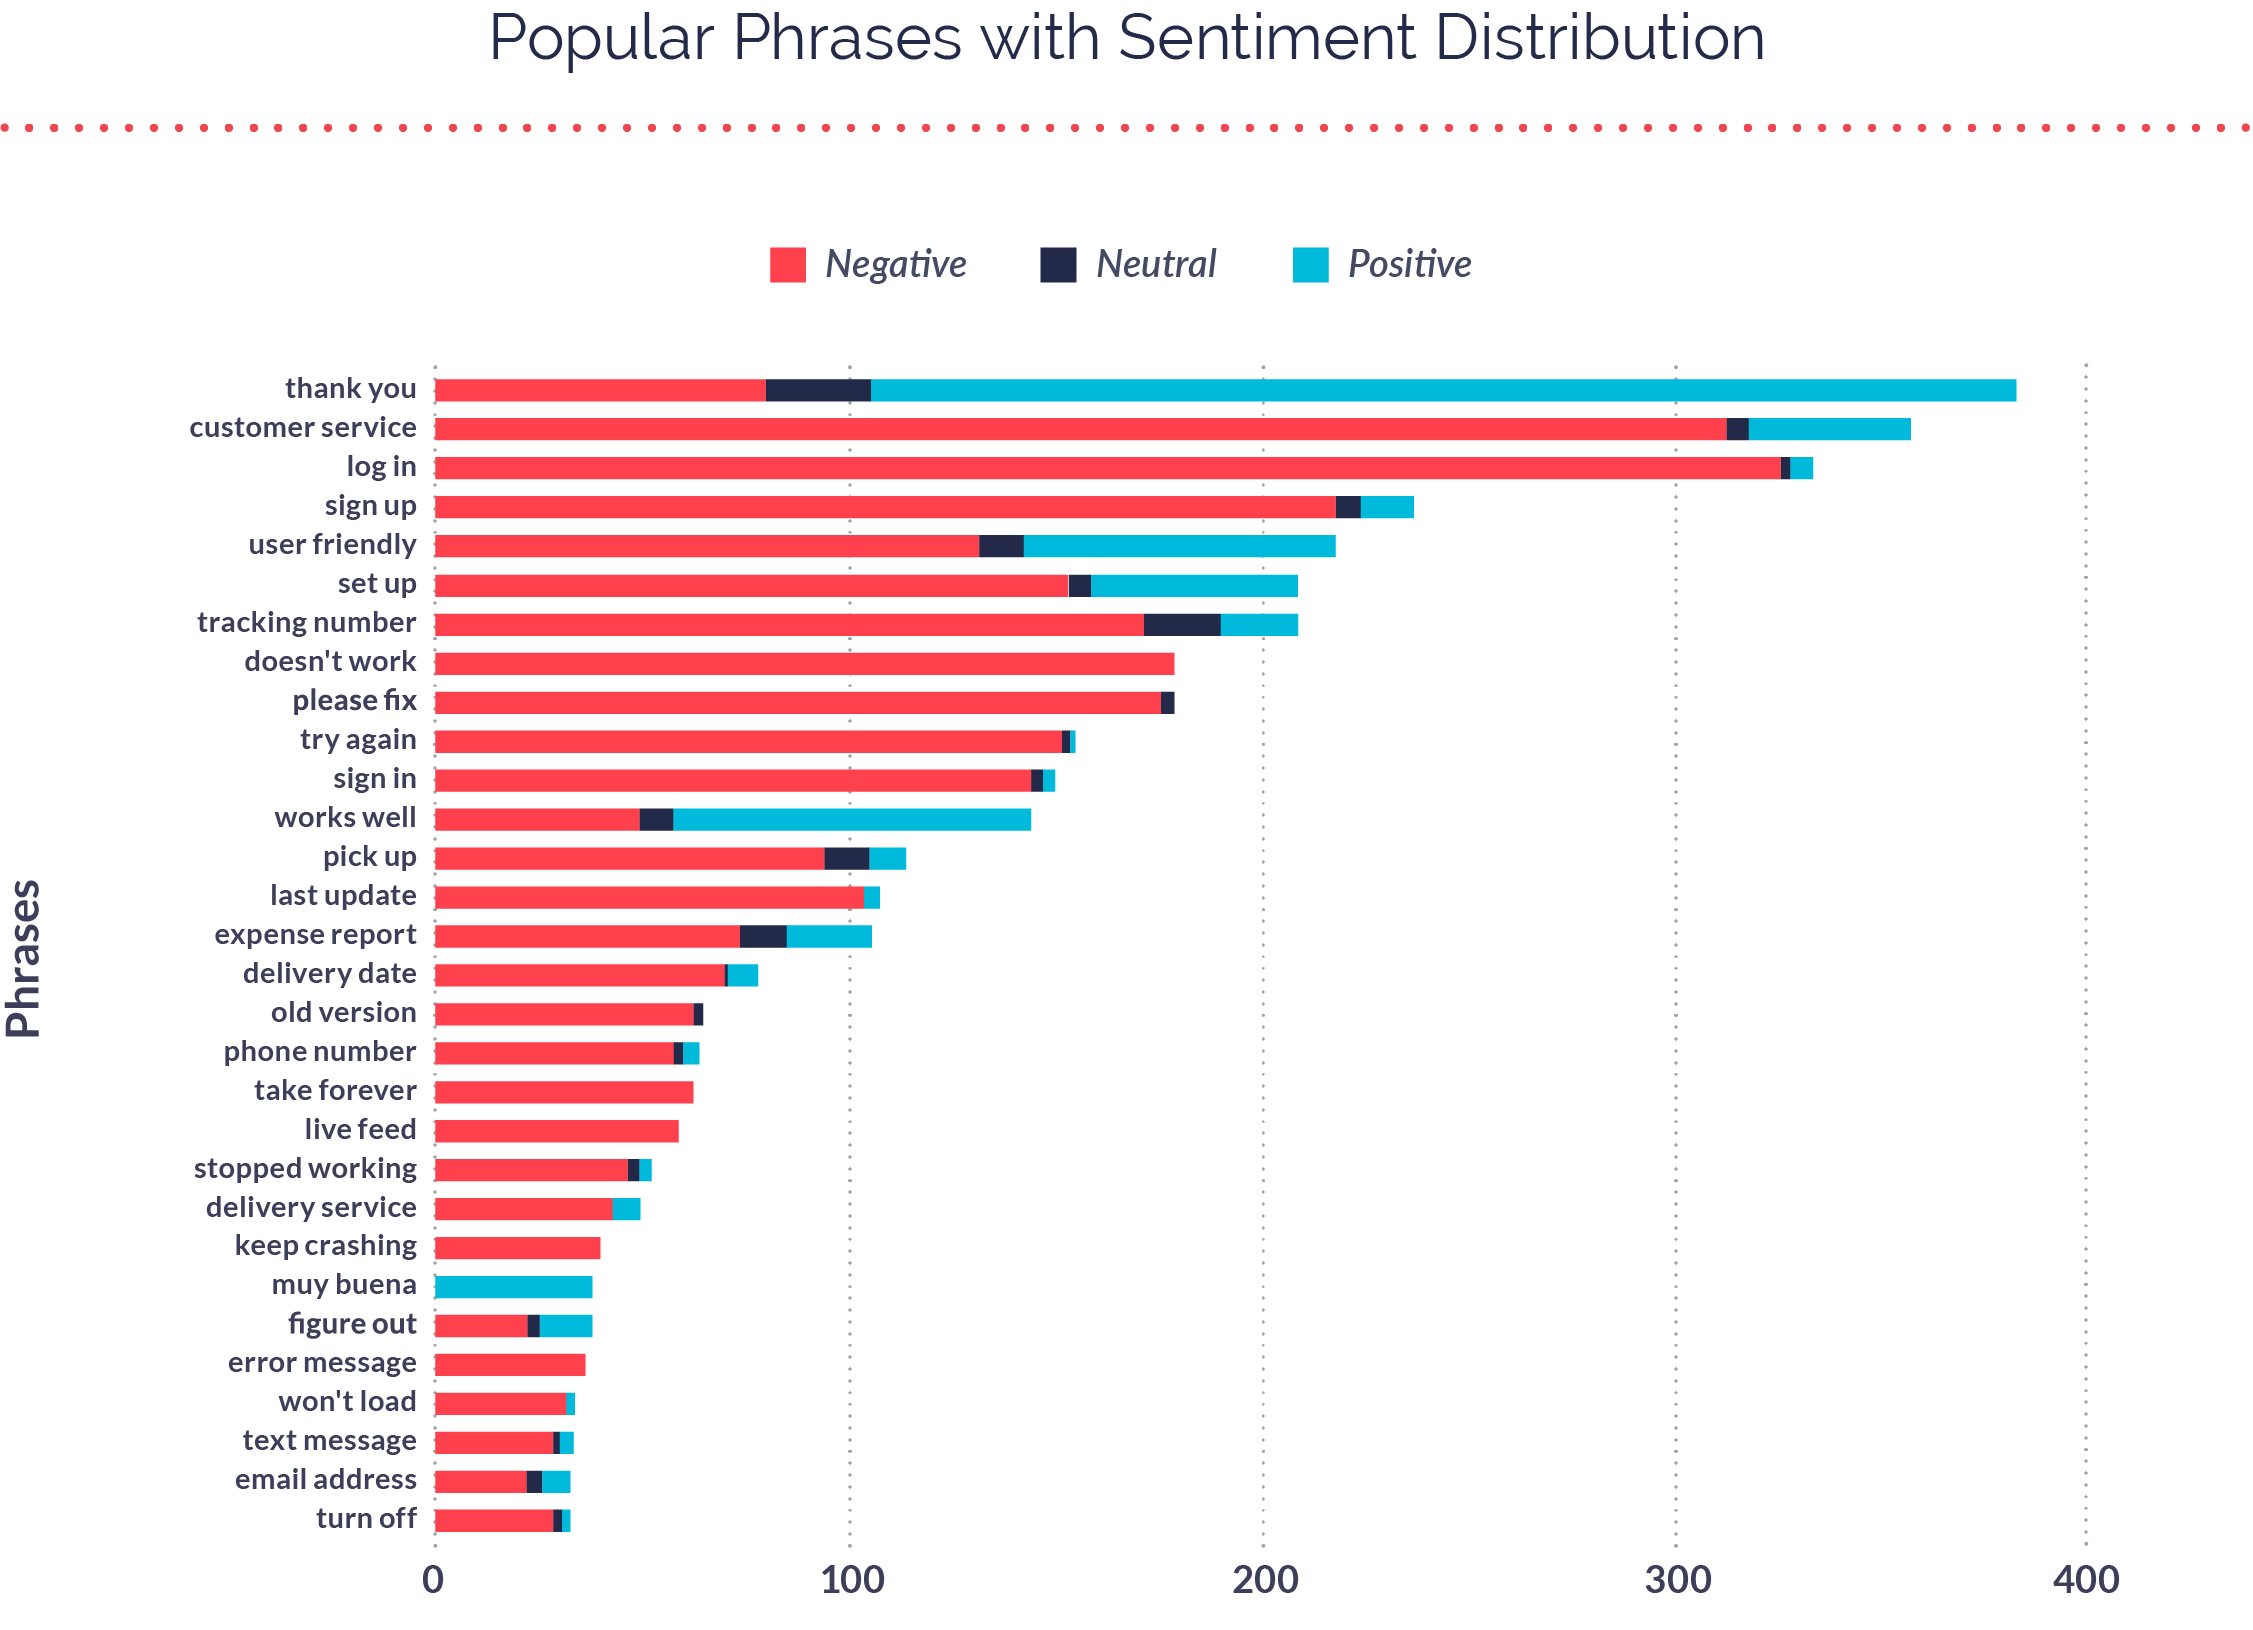
Below are the 10 most popular phrases in both iOS and Android app store reviews throughout 2020.
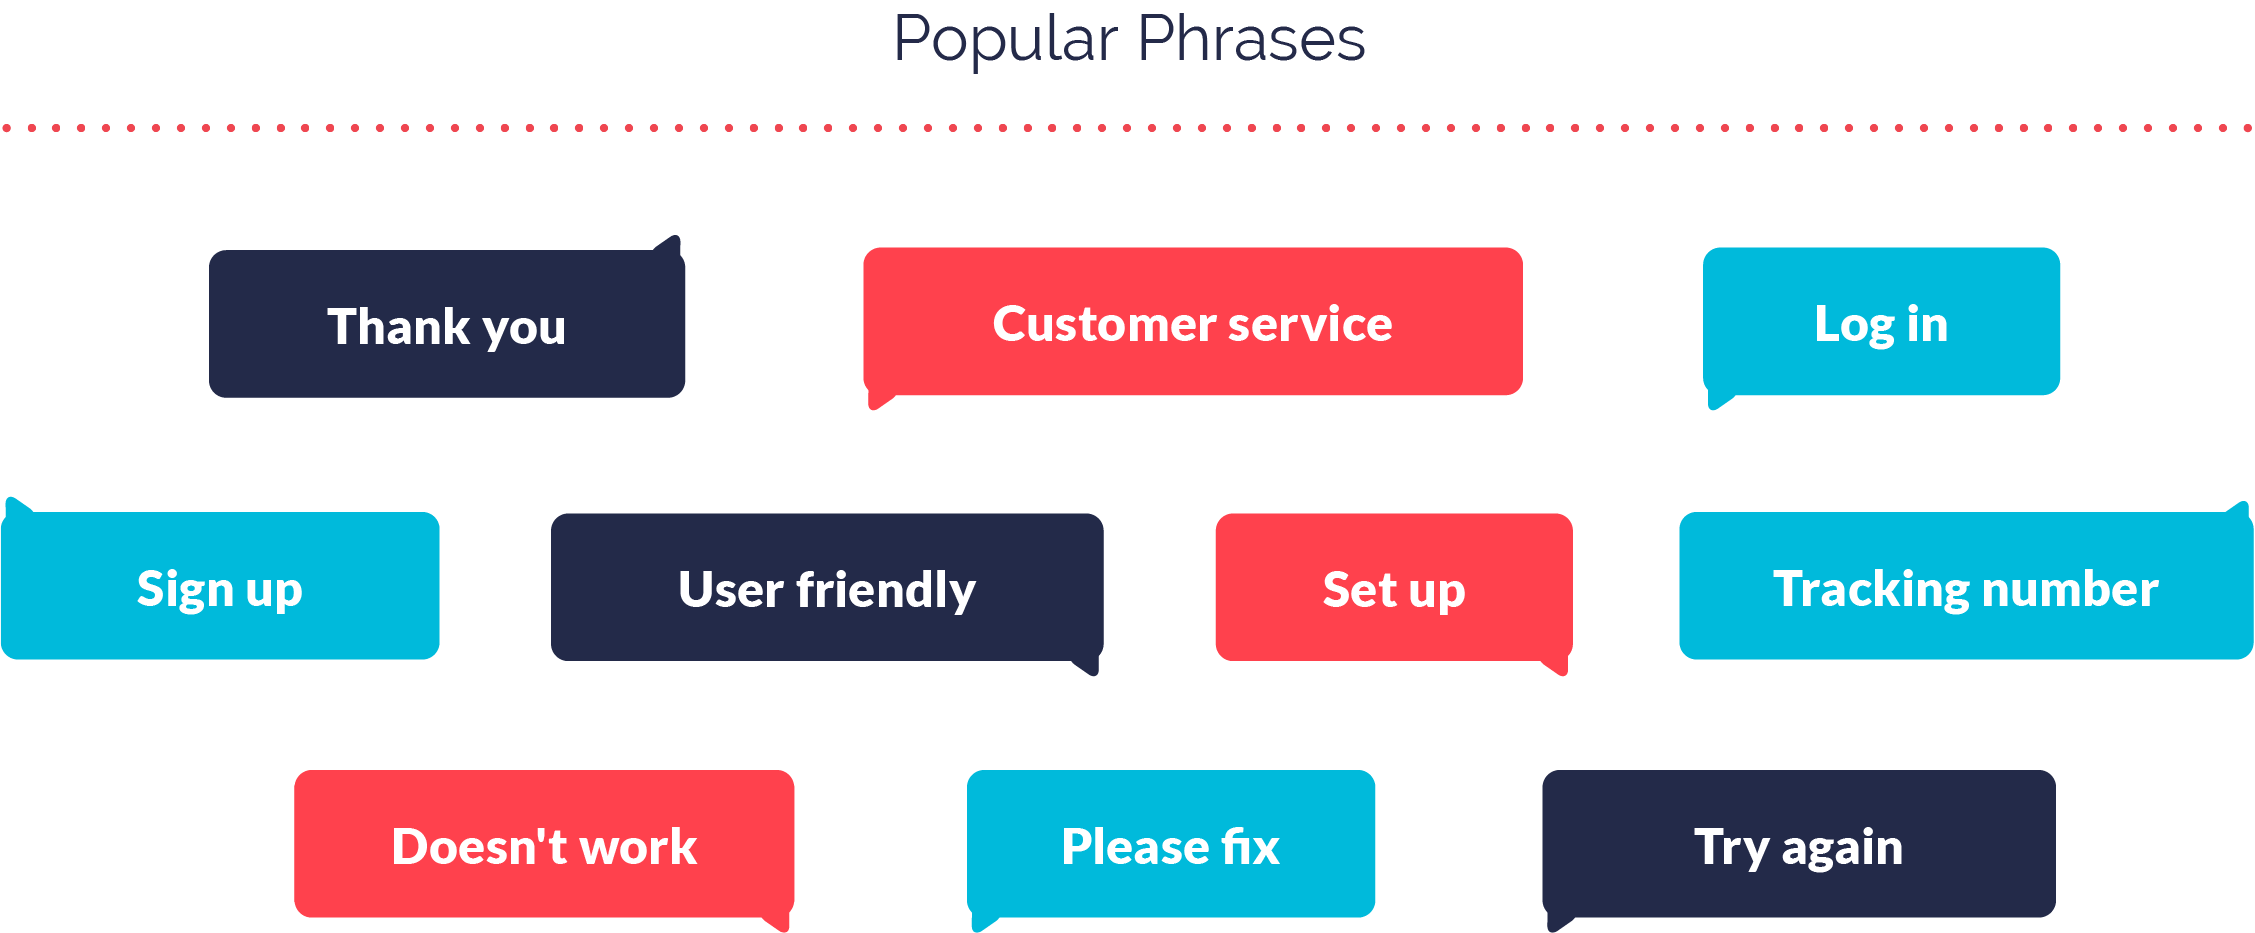
When we layer on sentiment distribution, you can see the difference between negative, neutral, and positive sentiment across app store reviews. The Business Services app category is especially prone to negative sentiment through reviews due to the nature of their business; it’s easy for consumers to leave frustrated feedback in the moment, and even easier for them to forget about positive experiences once they conclude.
Working in Mobile Business Services in 2021
While Business Apps apps survived 2020 relatively unscathed, the market is still fiercely competitive. As the data shows us, consumer loyalty in Business Services is long lasting and the opportunity for mobile teams to gain market share has never been greater.
For more on how mobile teams in Business Services can win back market share and improve feedback-based innovation, read our 2021 Mobile App Engagement Benchmark Report.