Before anyone walks through your business doors or clicks “Buy,” they’ve already formed an opinion based on what they...
You can have a strong national brand, brilliant campaigns, and a spotless website—and still lose...
Brand reputation management is one of the most powerful levers for growth. It shapes how...
Negative reviews happen. Even the most customer-focused businesses have off days, missteps, or misunderstandings. But here’s the...
Getting that elusive five-star review feels good—but don’t stop and pat yourself on the back. Replying to positive reviews isn’t just about...
Online reviews aren’t just digital noise—they’re the pulse of your reputation. Whether it’s Google, Facebook,...
Let’s be honest: reputation management used to mean spinning the message. Today, effective reputation management...
Google reviews aren’t just stars next to your name—they’re proof your brand delivers. And for...
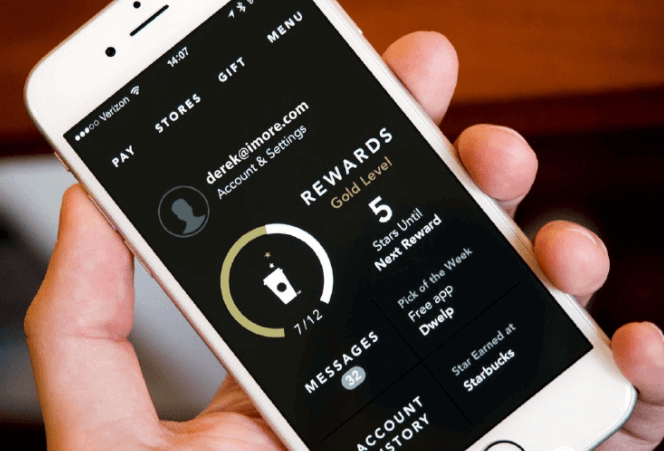
For many customers, their first interaction with a brand happens on a mobile device, so...
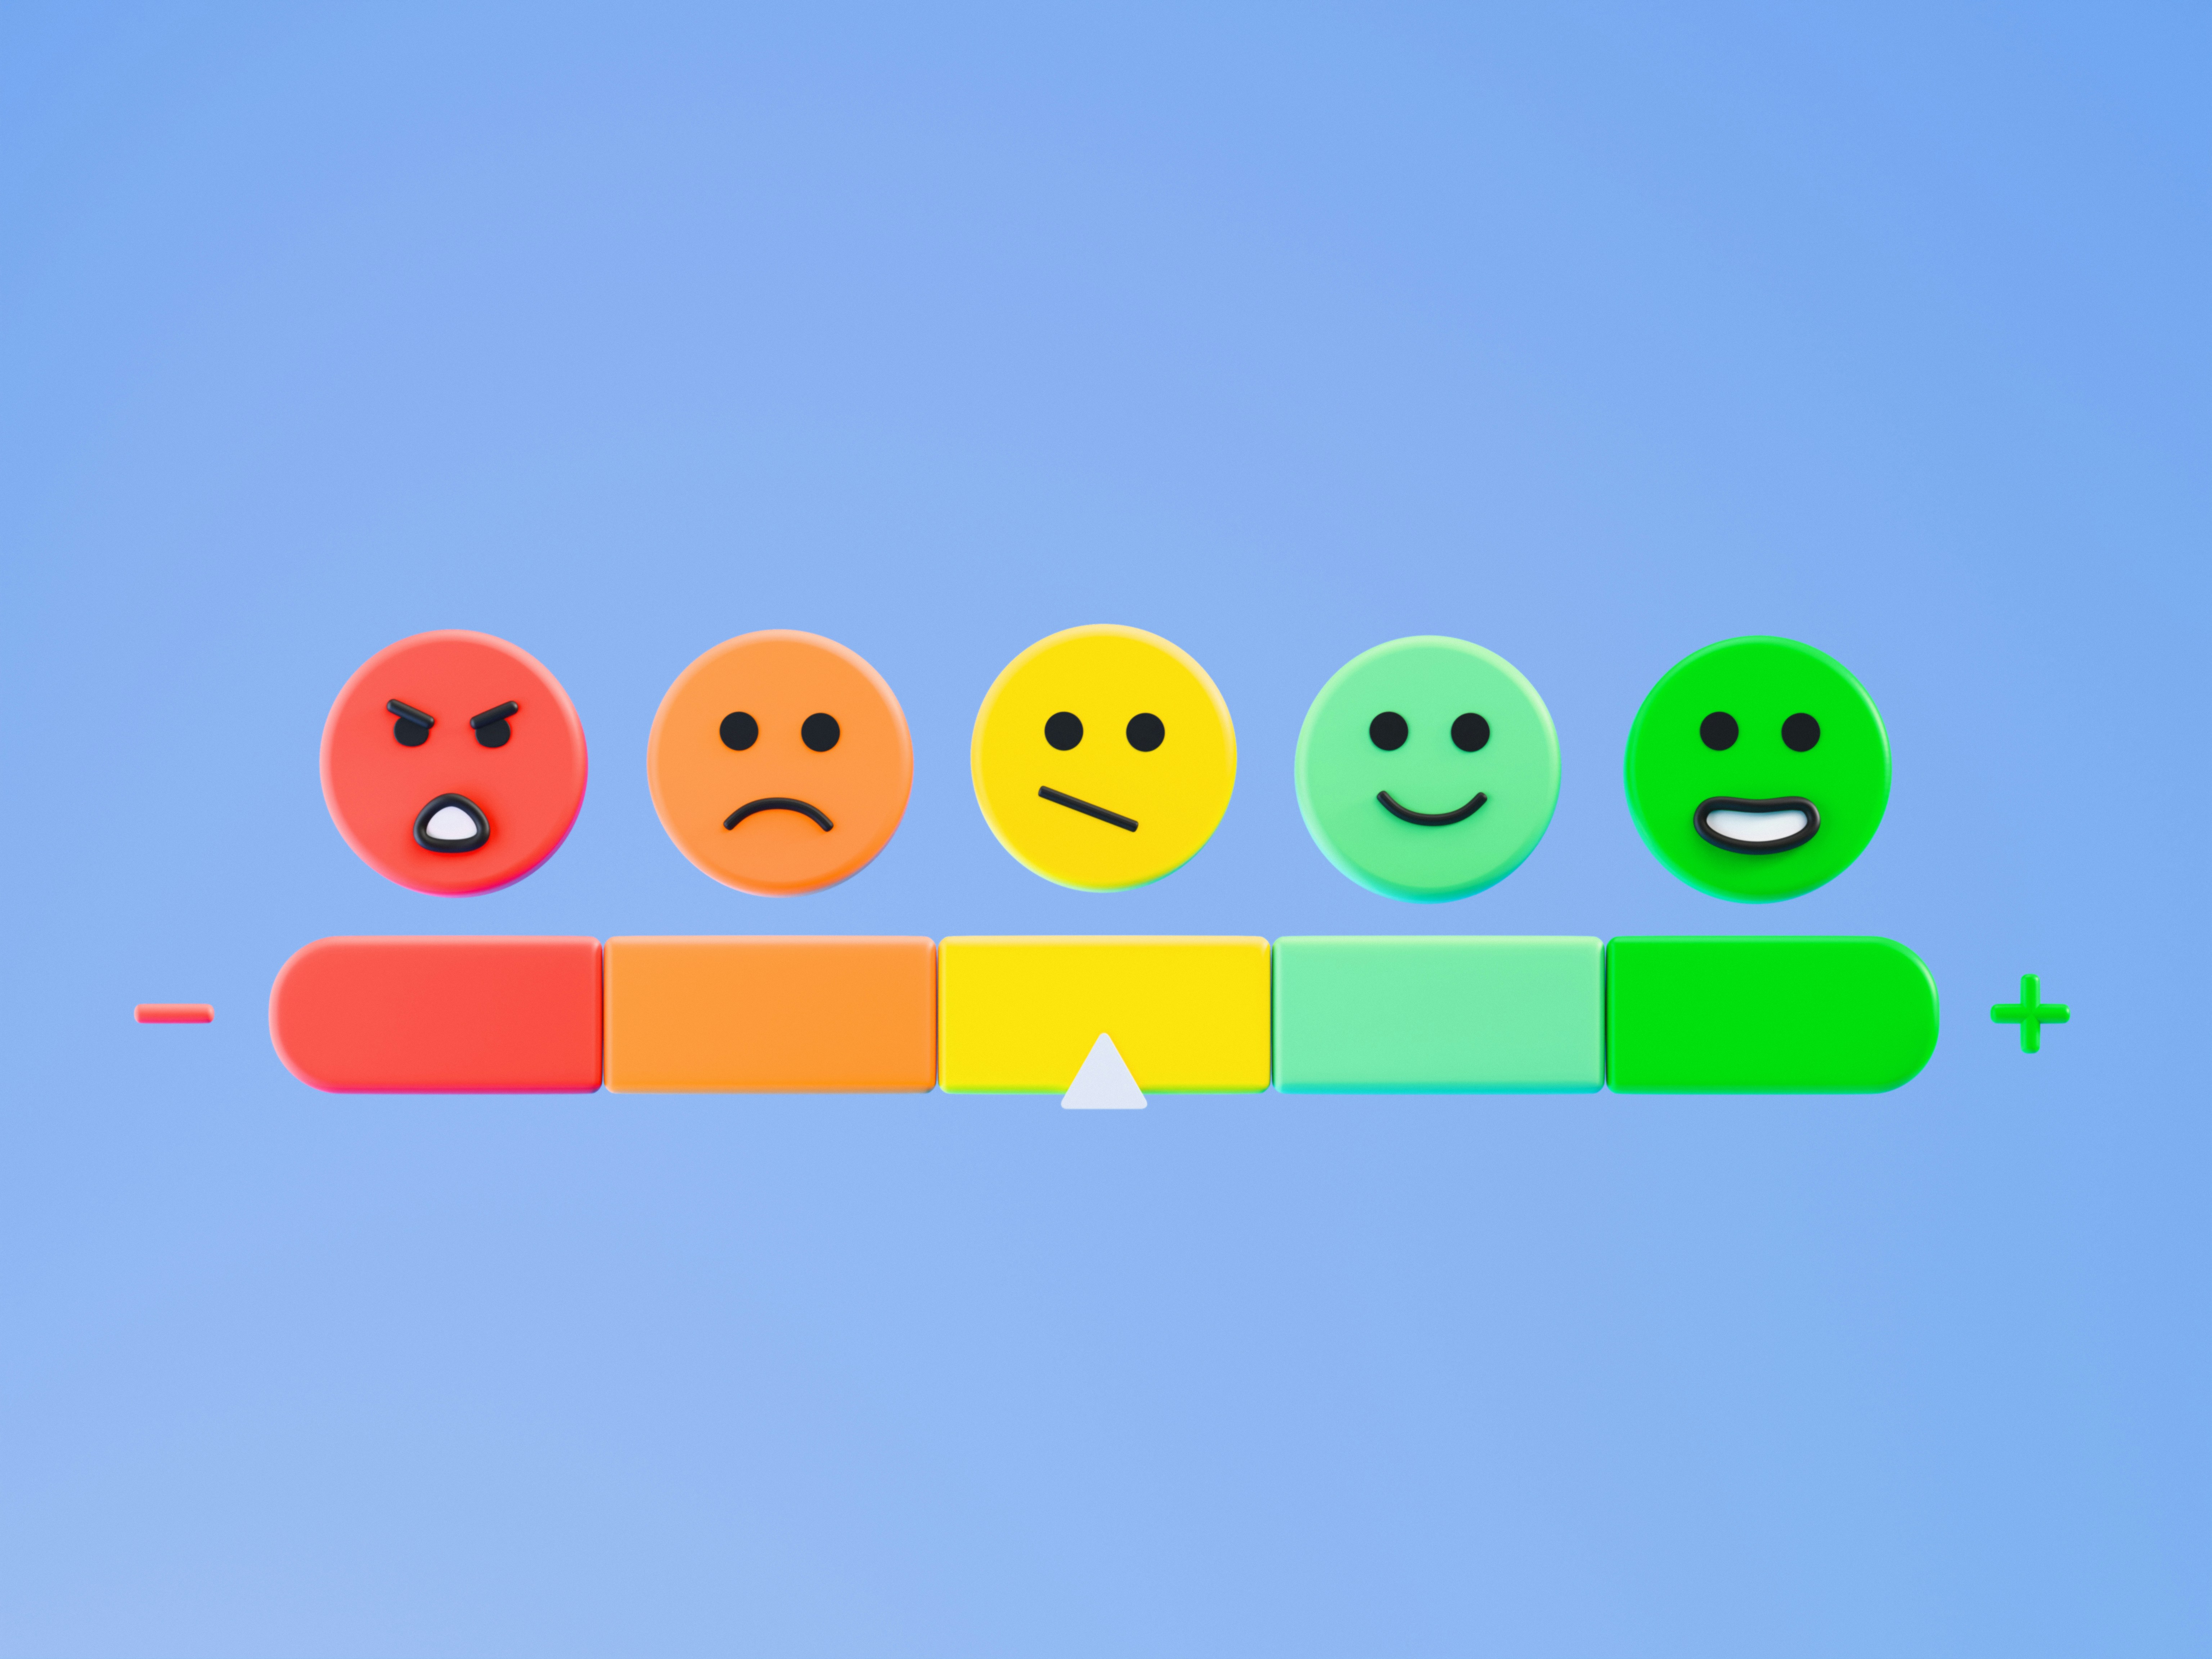
It all starts with a simple question: “Do you love our app?” This phrase has...
The following data and information on Shopping apps is from our 2022 Mobile App Customer...
The following data and information on Travel apps is from our 2022 Mobile App Customer...
The following data and information is from our 2022 Mobile App Customer Engagement Report. Subcategories...
Healthcare App Subcategories: Medical, Fitness, Health Insurance In our 2022 Mobile Customer Engagement Benchmark Report,...
Subcategories: Restaurant, Food Services In our 2022 Mobile Customer Engagement Benchmark Report, a study of...
“Customer engagement is the ongoing interactions between company and customer, offered by the company, chosen...
It’s common knowledge in the retail world that mobile customer loyalty and reward programs work...
Marketers are familiar with the traditional marketing funnel and the tactics that align with each...
Customer acquisition, ratings and reviews, and social proof are the most visible success indicators for...
One size did not fit all for Utilities apps in 2020. Depending on industry (energy,...
By accessing and using this page, you agree to the Terms of Use . Your information will never be shared.