
Like most professions, the world of data collection is full of jargon.
Market researchers who have spent years running complex projects can easily toss around sophisticated survey terms. However, many of us sometimes need a little help.
That’s why we’ve compiled this glossary of five common survey-related terms that may be a little tricky to get right. Take a glance, and soon you’ll be talking about non-biased cross tabulation using panel data with the best of them.
#1 Accessible
– adjective \ik-ˈse-sə-bəl, ak-, ek-\
- able to be reached or approached
- able to be used or obtained
When a survey is “accessible,” it functions the same for all respondents, regardless of the tools they use. Whether someone is using speech-to-text software, screen readers, or keyboard navigation, the survey works just as smoothly as it does for those responding in more traditional ways.
To meet these requirements, you’ll need to be mindful of the question types, fonts, alt text, and interactions. Here’s a rundown of best practices.
#2 Bias
– noun \ˈbī-əs\
- a tendency to believe that some people, ideas, etc., are better than others that usually results in treating some people unfairly
Honestly, the Merriam-Webster definition doesn’t provide all that much clarity for our purposes, so let’s create another definition.
- a distortion, either conscious or unconscious, of survey data. It may affect the accuracy of conclusions or actionable decisions based on that data.
There are several kinds of bias related to surveys and data collection, but the two most relevant to us are response and non-response bias. The first type is response bias, also known as the Hawthorne effect. Data skews when the quality of the questions asked or the method of collecting responses is poor.
For example, if you ask, “Do you think purple is the best color in the world?” you’re going to get very different answers than if you ask, “Which color is your favorite?”
Neutral, fact-based wording can greatly improve the quality of the data you collect.
Another kind of bias to be aware of is non-response bias. This type of survey bias relates to the sample of respondents rather than how the question is structured.
For example, if your goal is to survey an accurate sample of the population to learn about overall color preferences, you would aim for a perfect cross-section of the population. This approach helps ensure you collect accurate data.
The bottom line: surveying an appropriate and significant sample relative to your research goals is imperative in avoiding non-response bias.
#3 Crosstab Data Analysis
– noun \ˈkrȯs\ \ˈtab\
- a type of analysis or summary for categorical analysis that usually concludes with a contingency table.
Market researchers frequently utilize cross-tabulation analysis, commonly known as cross-tab. This method illustrates the relationship between two different variables. For instance, it can show the connection between gender and pet preference.
The value of this type of data analysis lies in its ability to quickly determine the correlation between two variables. This correlation might not be apparent when viewing the entire data set as a whole.
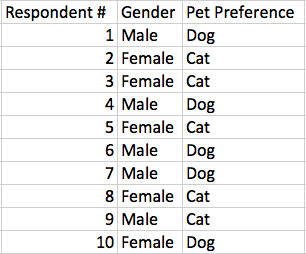
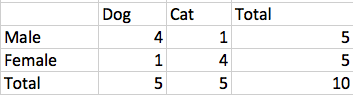
In simple terms, a cross-tab report enables you to cross-tabulate at least two questions. You place one question on the horizontal axis and another on the vertical axis. You can use cross tabs to analyze what is driving your survey results by more closely examining trends and patterns.
#4 Panel
– noun \ˈpa-nəl\
- a group of people who answer questions, give advice or opinions about something, or take part in a discussion for an audience
A panel in the research world isn’t too far from the standard definition above. Survey panels are simply a collection of people who have indicated a willingness to take surveys. The organization compensates participants for their time and effort. Additionally, the organization that facilitates survey distribution to their panel audience, known as a panel company, charges a fee for access to this audience.
Why use a panel?
Imagine you’ve been assigned to discover what the target demographic of your new website (still in beta) thinks about your designs. But you haven’t launched the site yet, so you can’t depend on current customers to provide you with feedback.
This is a great time to employ a panel.
Panel companies collect a lot of data about their panelists, so you can get very specific about the type of people who want to take your survey. If we designed our hypothetical website to appeal to middle-aged men with families, we could easily target only those respondents using a panel.
We have several extensive guides to running successful surveys with panels, so you can make sure you’re spending this portion of your budget wisely.
Collect Better Data With Panels Our insider guide shows you how. Get the Ebook
#5 Piping
– noun \pī′pĭng\
- to automatically populate content in a survey based on answers or data previously collected in the survey
Piping can be a very confusing term, because it’s an online survey that doesn’t have an actual pipe anywhere in sight. But piping simply means pre-populating a survey question using information you already have.
This could be pulling in data from a Salesforce record, or grabbing the name your respondent entered on the first page and using it to thank them for completing your survey.
Piping is a great way to reduce survey fatigue because it reduces the amount of data entry that a respondent needs to do. They only have to enter their name and favorite color one time; you can pipe their response into future questions to speed things along.
What Other Survey Terms Should We Cover?
Let us know what survey terms you’ve found confusing in the past with a quick comment. We’ll continue expanding our glossary to help demystify the survey process for everyone.