
Media and Entertainment apps played a critical role in helping us get through 2020. While the world around us shifted in response to the pandemic, consumers turned to media apps as an outlet to stay informed, connect with loved ones, decompress, and even have some laughs.
In our 2021 Mobile App Engagement Benchmark Report, a study of 1,000 apps across a billion+ app installs, we take a close look at apps in the Media and Entertainment category. But the category is broad, encompassing everything from news to games to sports, and consumer expectations and behavior varies dramatically between industries.
In our data, Media apps are segmented into six subcategories:
- News (global news networks, newspapers, etc.)
- Music (streaming, broadcasting, etc.)
- Technology (media creation, connectivity, etc.)
- Games (mobile games, gaming studios, etc.)
- Sports (leagues, teams, betting, etc.)
- Telco (communications providers, wireless networks, etc.)
Below are short summaries of the six subcategories included in our research, with engagement benchmarks for companies to aim for in 2021.
2021 Engagement Benchmarks for Media Apps
News Apps
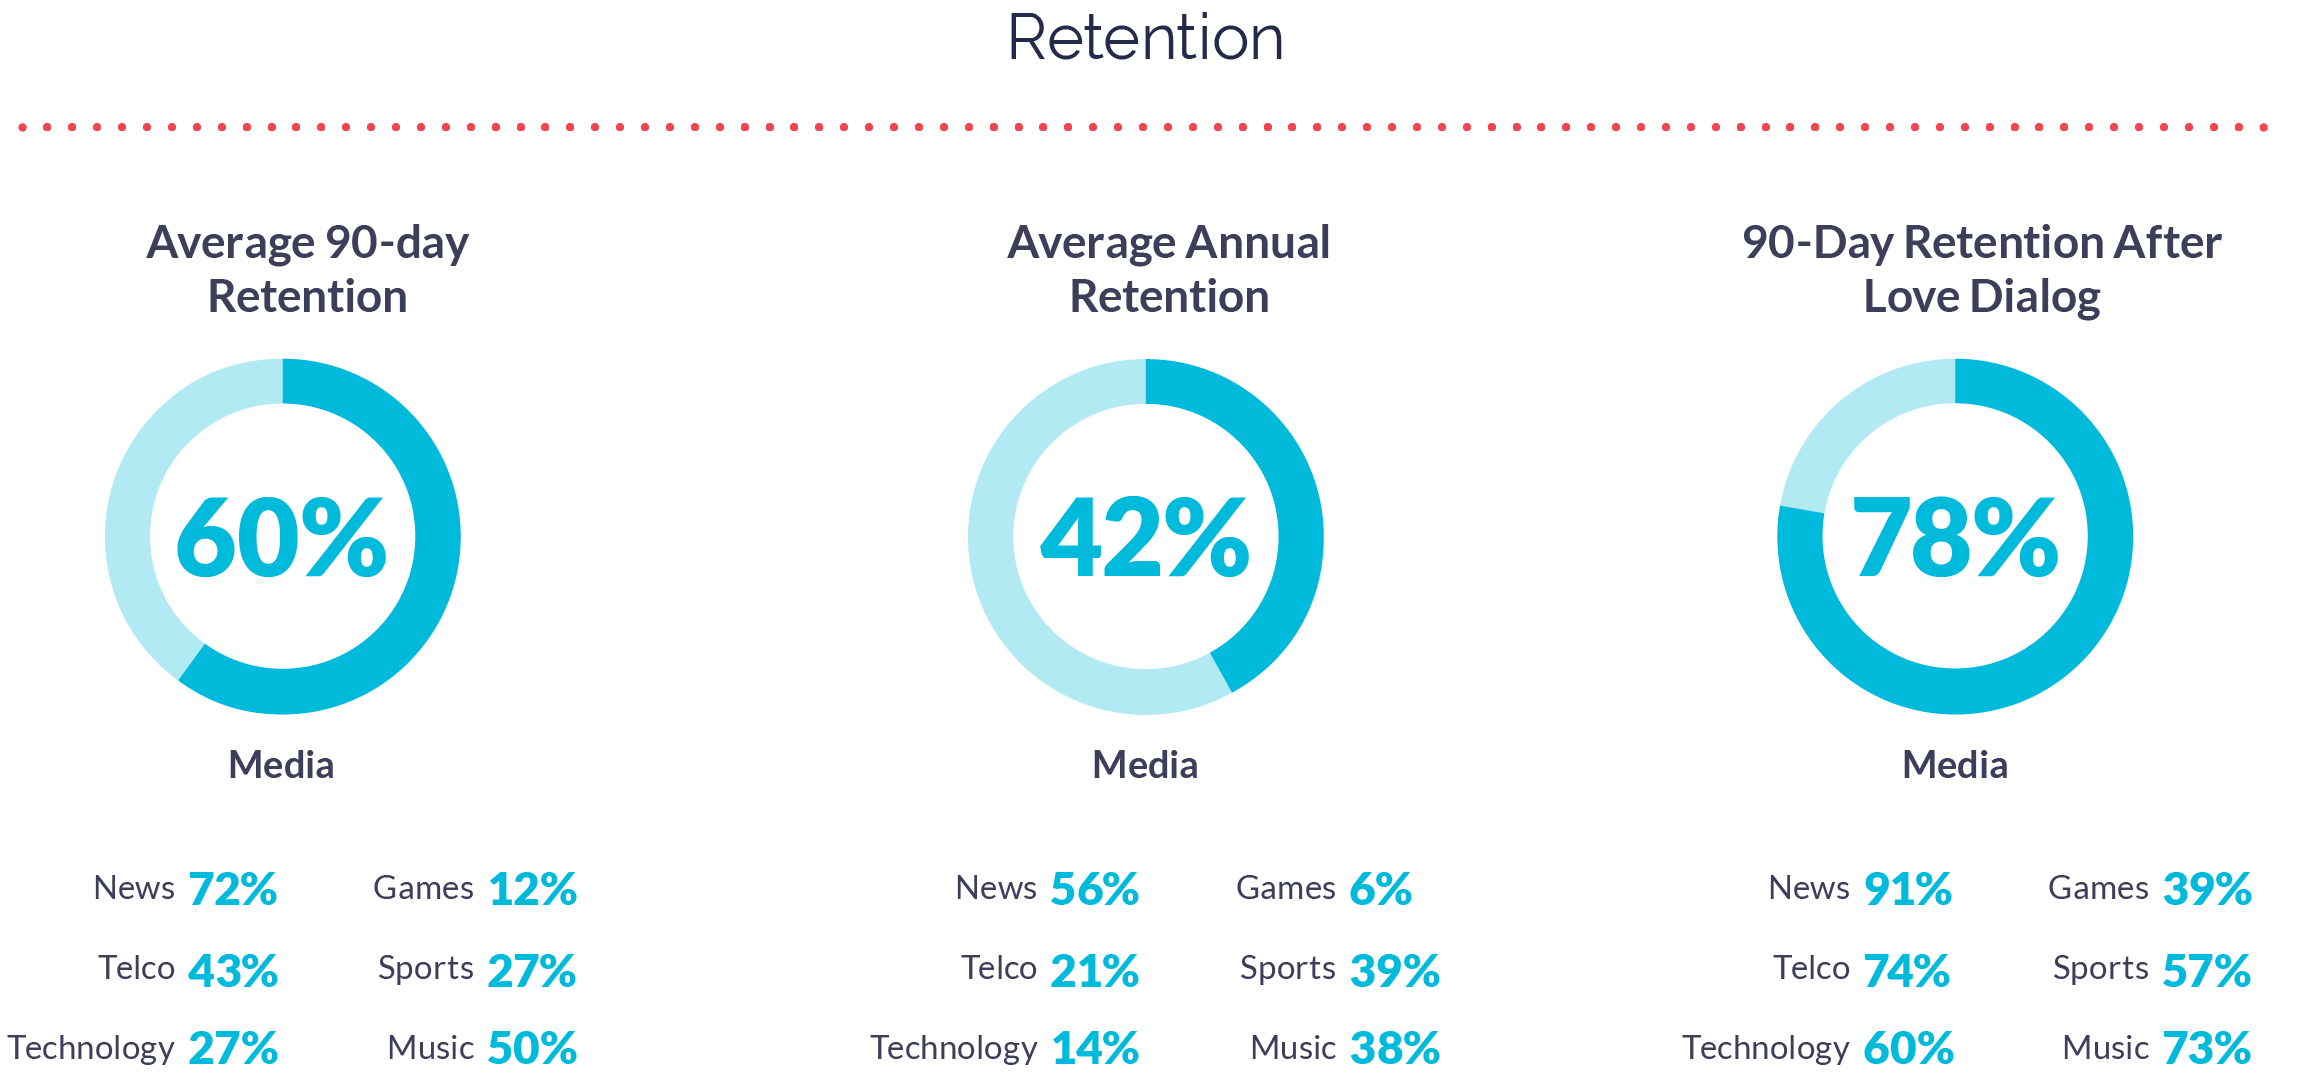
What a year for news. News apps saw incredibly high retention rates, likely due to how much news people consumed and the fact that there was breaking news almost daily. Their 90-day retention was 72%, much higher than the macro average of 48%; annual retention was 56%, again much higher than macro average of 35%.
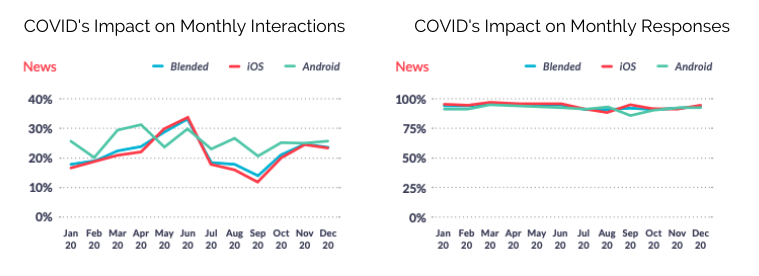
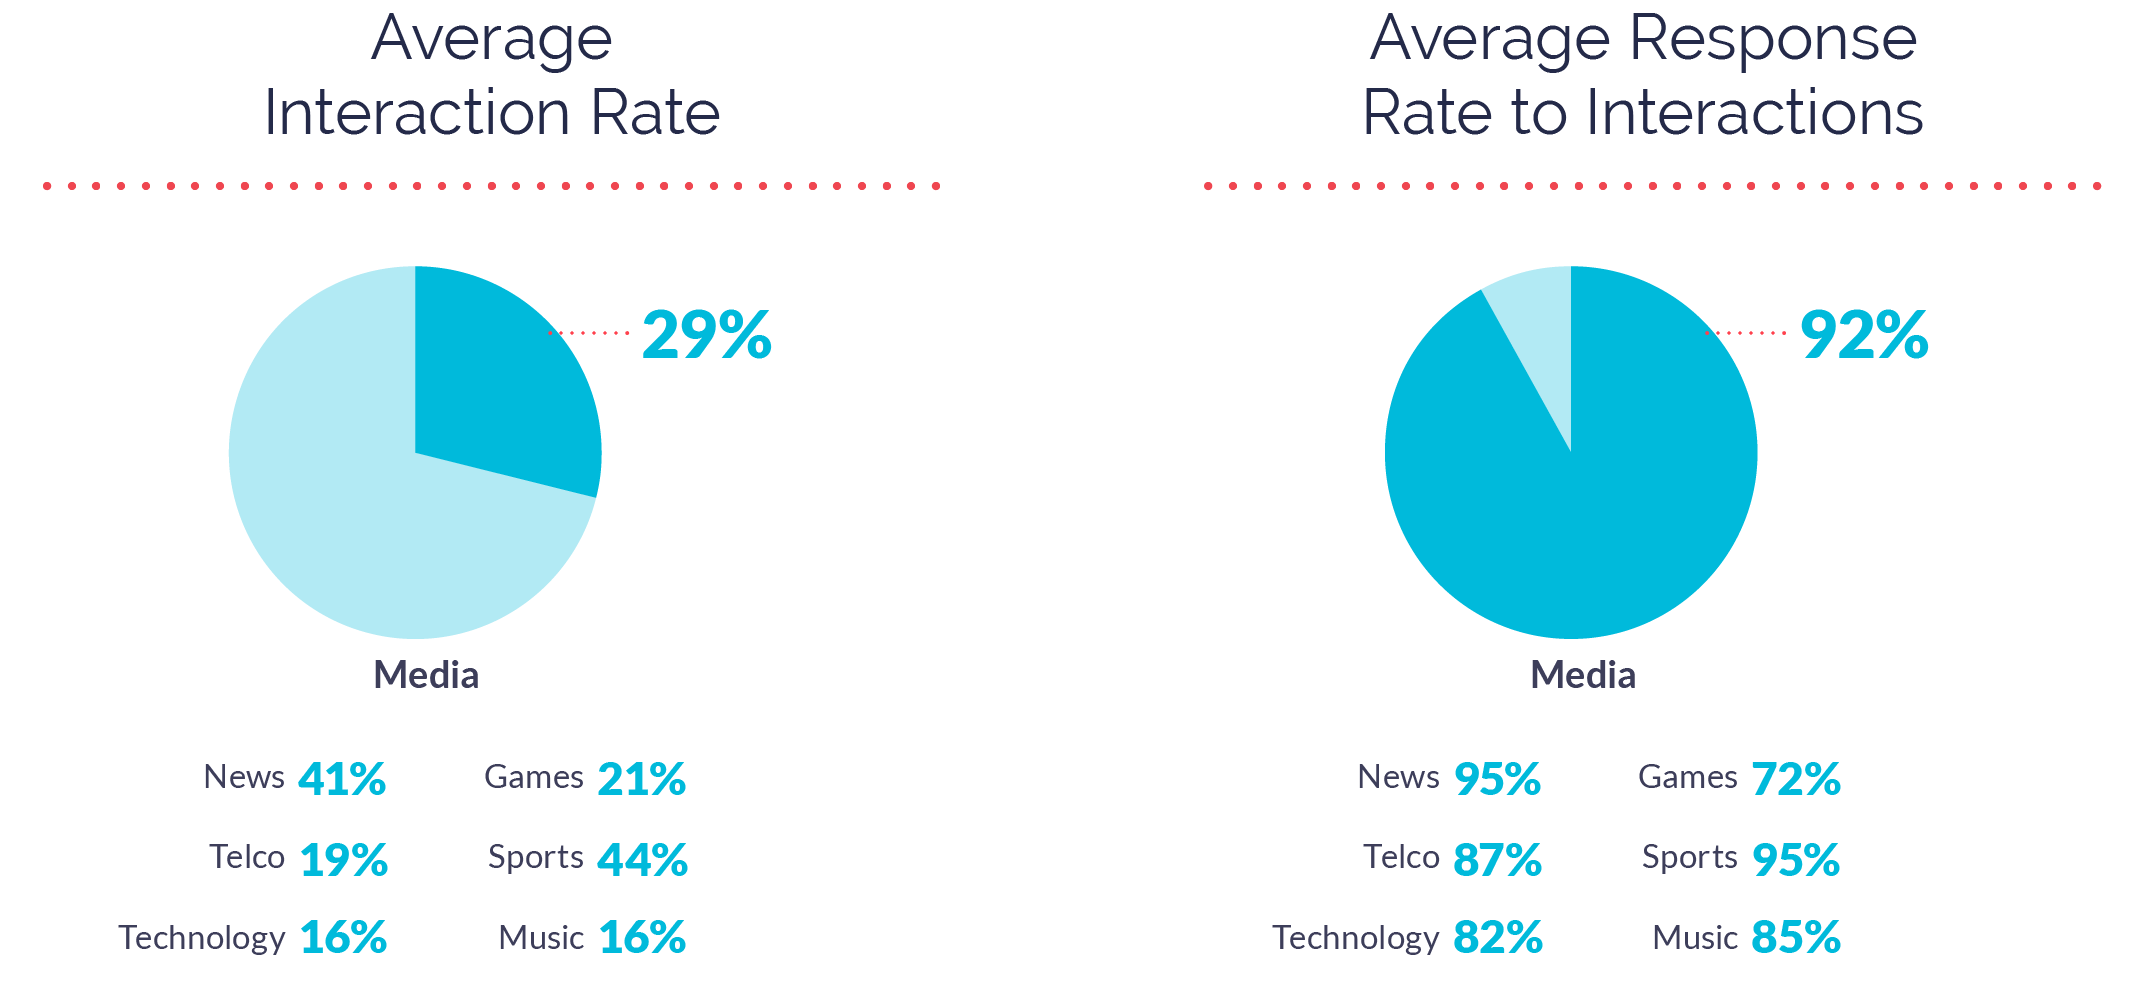
Due to the amount of breaking news coverage, News apps had a high interaction rate of 41% (macro average is 26%), with a response rate of 95% that remained consistently high throughout the year.
News apps prioritized hearing from customers by prompting 32% of consumers for in-app surveys, higher than the macro average of 25%. Their survey response rate was 11%, slightly lower than the macro average of 16%—but when surveys were presented with a Note, response rate went up to 71% (macro average 60%).
News apps did, however, respond to many fewer inbound messages than other apps (17% vs macro average of 72%) mostly due to how much trolling they receive about the news itself rather than their product; those messages are not typically responded to.
Music Apps
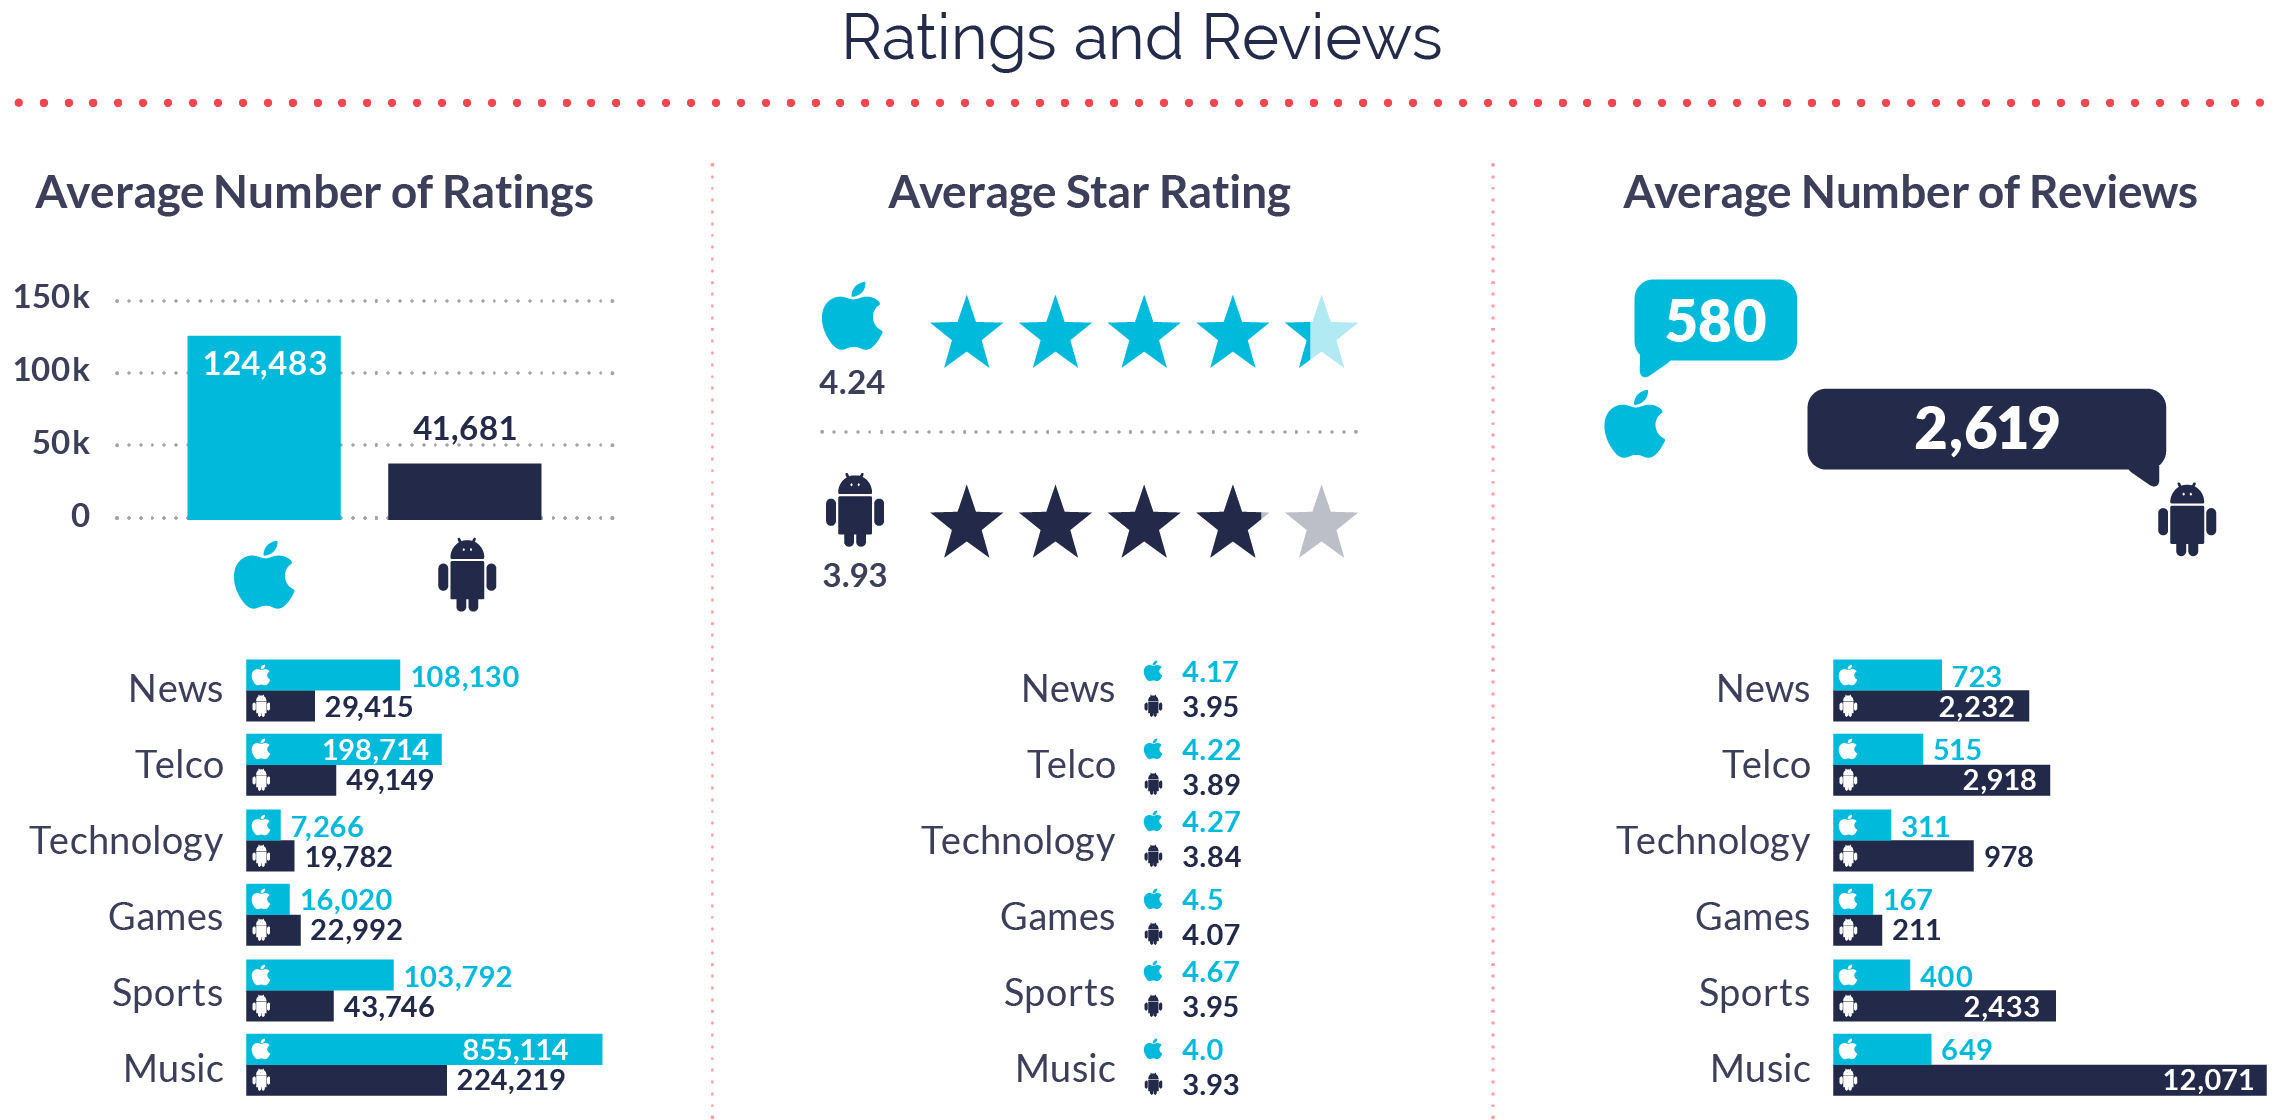
Music apps had the most app store ratings and reviews out of all Media subcategories. However, their overall ratings were slightly lower than the category average.
Music apps saw strong retention for both their 90-day rate (50% compared to the 48% macro average) and annual rate (38% compared to the macro average of 35%). Their interaction rate (16%) and response rate (85%) were slightly lower than macro averages (26% and 92%). However, consumers showed their love for Music apps by giving them a Love Percent of 87%, way above the macro average of 65%.
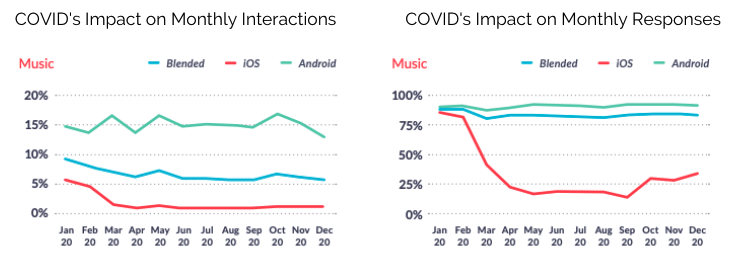
But while many consumers shared their love, Music apps also experienced lots of shifting emotions at -10% (macro average is -4%).
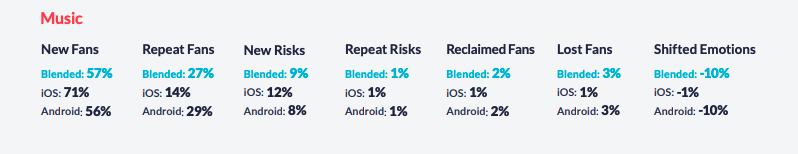
For success in 2021, mobile teams have an opportunity to proactively get ahead of shifts in emotion by reaching out to a higher percentage of consumers; Music apps only prompted 2% of consumers for surveys, well below the macro average of 25%.
Technology Apps
Technology apps saw lots of consumers shifting emotions in 2020, with -8% shifted emotions vs the macro average of -4%.
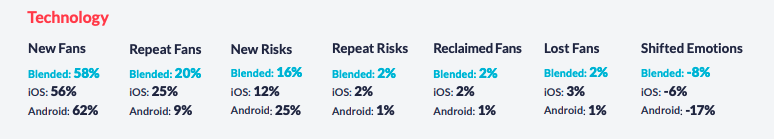
They also had low retention across the board, with a 90-day retention rate of 27% (macro average is 48%) and an annual retention rate of 14% (macro average is 35%). These low numbers are partly due to not reaching out to enough consumers. Technology apps only prompted 9% of their consumers for surveys compared to the macro average of 25%, and didn’t prioritize responding to inbound messages (27% response rate vs the macro average of 72%). But when they did prompt for surveys, their average response rate (18%) was higher than the macro average of 16%.
While they saw a Love Percent of 79% (above the macro average of 65%), it’s likely inflated as not enough consumers were asked whether or not they love the company.
Technology apps have a big opportunity in 2021 and beyond to reach more of their consumers through proactive engagement to get ahead of shifting emotions, and ultimately improve retention.
Games Apps
Games apps saw poor retention in 2020, with a 90-day retention rate of 12% (macro average is 48%) and an annual retention rate of 6% (macro average is 35%). While higher churn is common in the gaming marketplace, these numbers are still low and can be improved.
A big contributor to Games apps’ low retention was not reaching out to a large enough group of consumers in order to gauge sentiment and build out product roadmaps that work for the majority—Games apps only reached out to 2% of consumers for surveys, far below the macro average of 25%.
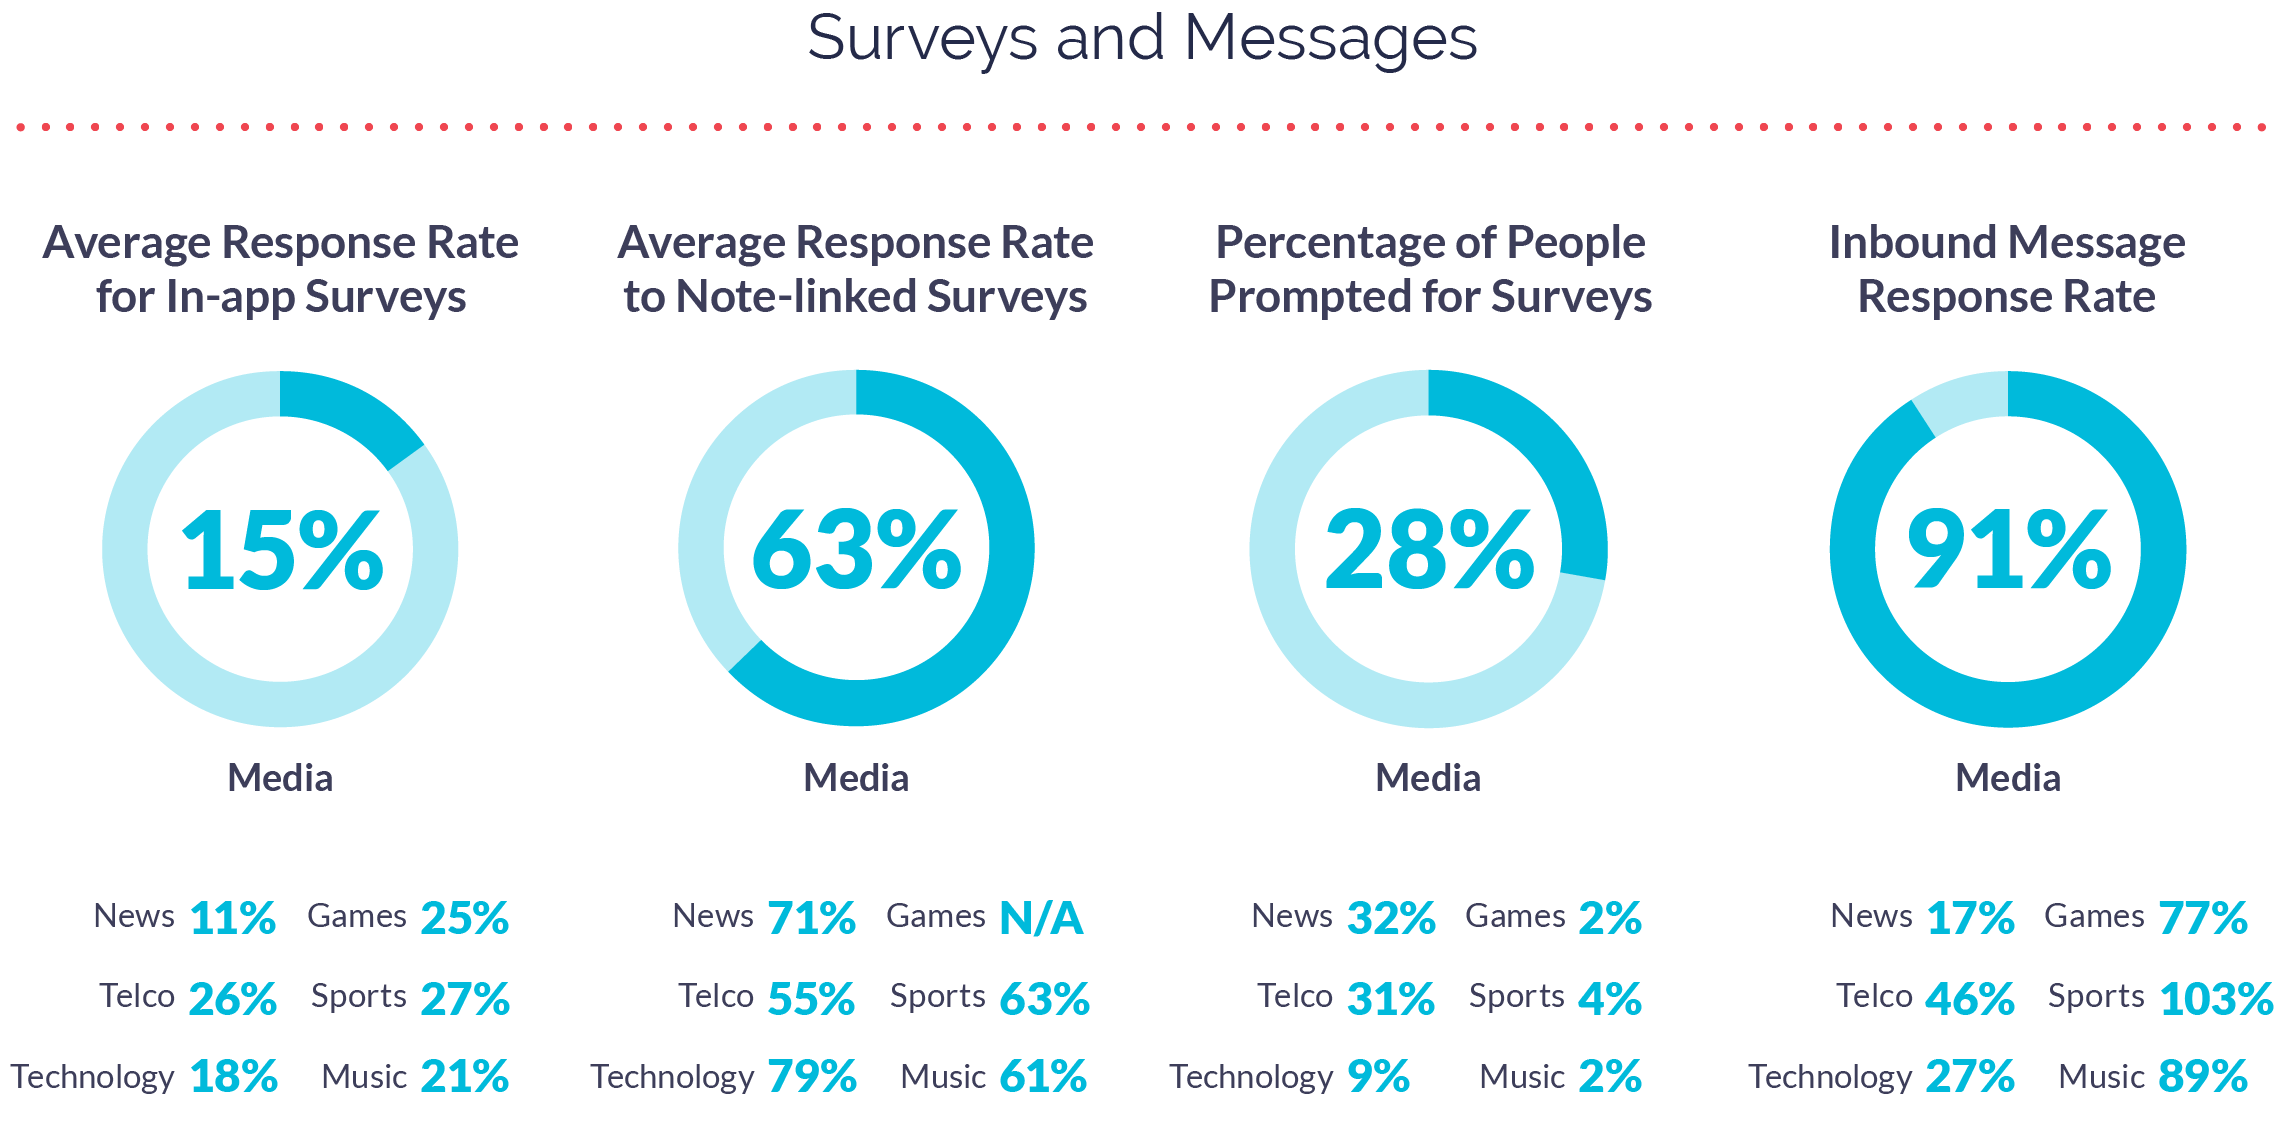
But while few in number, their surveys were successful. Games apps saw a survey response rate of 25%, above the macro average of 16%. They also had a high inbound message response rate of 77% compared to the macro average of 72%.
The 2021 strategy for a successful Games app includes expanding consumer reach to gather and act on a more accurate voice of the customer.
Sports Apps
Sports apps had a high interaction rate (44%) compared to the macro average of 26%.
Mobile teams sent many fewer interactions in the first half of the year while sporting events were put on pause due to the pandemic, while August saw a spike in interactions which then held through the end of the year.
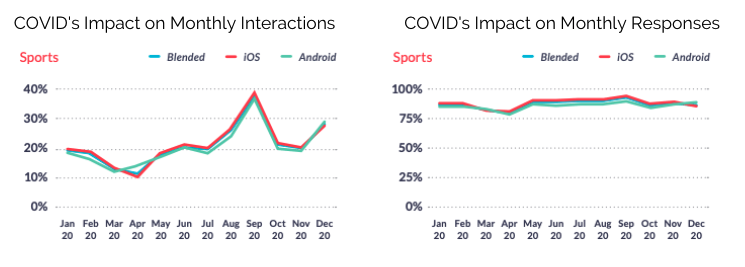
Sports apps had a consistently high response rate (95% compared to the 92% macro average). Their retention rates were relatively normal for the category, with 90-day retention less than the macro average (27% compared to 48%) but annual retention higher than the macro average (39% compared to 35%). This is mostly due to seasonality (e.g. a consumer can disappear for the off-season then reappear the next season).
While Sports apps had a high survey response rate of 27% (macro average is 16%), they prompted a very small amount of consumers (4% compared to the macro average of 25%) for feedback—an opportunity to improve upon in 2021 and beyond.
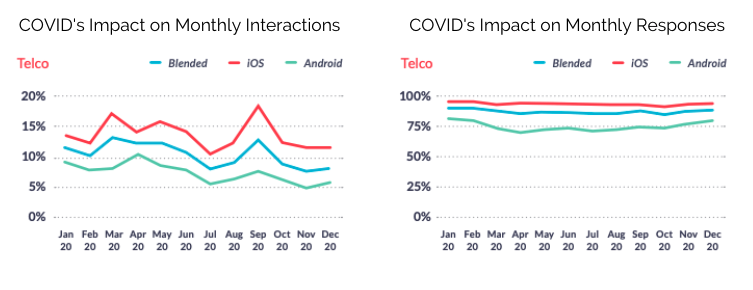
Telco Apps
2020 retention for Telco apps was slightly lower than the macro average. They saw a 90-day rate of 43% (vs 48%) and an annual retention rate of 21% (vs 35%).
Telco apps’ lower retention could be impacted by their lower number of interactions. The apps engaged fewer interactions than the macro average (19% compared to 26%), although their response rate remained relatively high (87%) and consistent throughout the year.
But it’s not for lack of trying. Telco apps prompted 31% of consumers for surveys, higher than macro average of 25%. As a result, their average response rate was 26%, higher than macro average 16%. And while Telco companies aren’t necessarily known for prioritizing customer love, consumers love their apps. Telco apps had a Love Percent of 70%, higher than the macro average of 65%.
Working in Mobile Media in 2021
Media apps helped connect us in a year where we were distant. The rapid adoption and sustained use of Media apps has shaped the trajectory of the industry, and mobile teams are only beginning to explore the full impact their work has on their business as a whole. 2021 is an opportunity for those working in mobile media to capitalize on new market share, explore new engagement opportunities, and deeply understand how customer emotion impacts in-app actions.
For more on how mobile teams in Media can improve feedback-based innovation, read our 2021 Mobile App Engagement Benchmark Report.