Education was one of the hardest hit industries in 2020. Quick transitions to remote learning, usage and integration hurdles, lack of funding for new tech, and massive fluctuations in MAU all played a role in delivering a challenging year for educators and education technology across the country.
In our 2021 Mobile App Engagement Benchmark Report, a study of 1,000 apps across a billion+ app installs, we take a close look at apps in the Education category. But the category is broad, and consumer expectations and behavior varies dramatically between industries.
Read on for data-supported research and benchmarks Education apps should focus on in 2021 and beyond based on what was learned from a year like no other.
2021 Engagement Benchmarks for Education Apps
Retention
Let’s start with the bad. Education apps saw some of the worst retention rates in 2020, especially in annual retention (4% compared to the macro average of 35%).
Obviously many factors contributing to the drops in Education app retention were outside of mobile teams’ control. As schools and digital platforms scrambled to adjust to remote learning, the impact on retention didn’t always reflect the overall experience with an app. While concerning, this is a solvable problem for mobile teams in 2021 as people slowly begin to get back into a normal groove with their education systems and preferences.
Ratings, Reviews, and Interactions
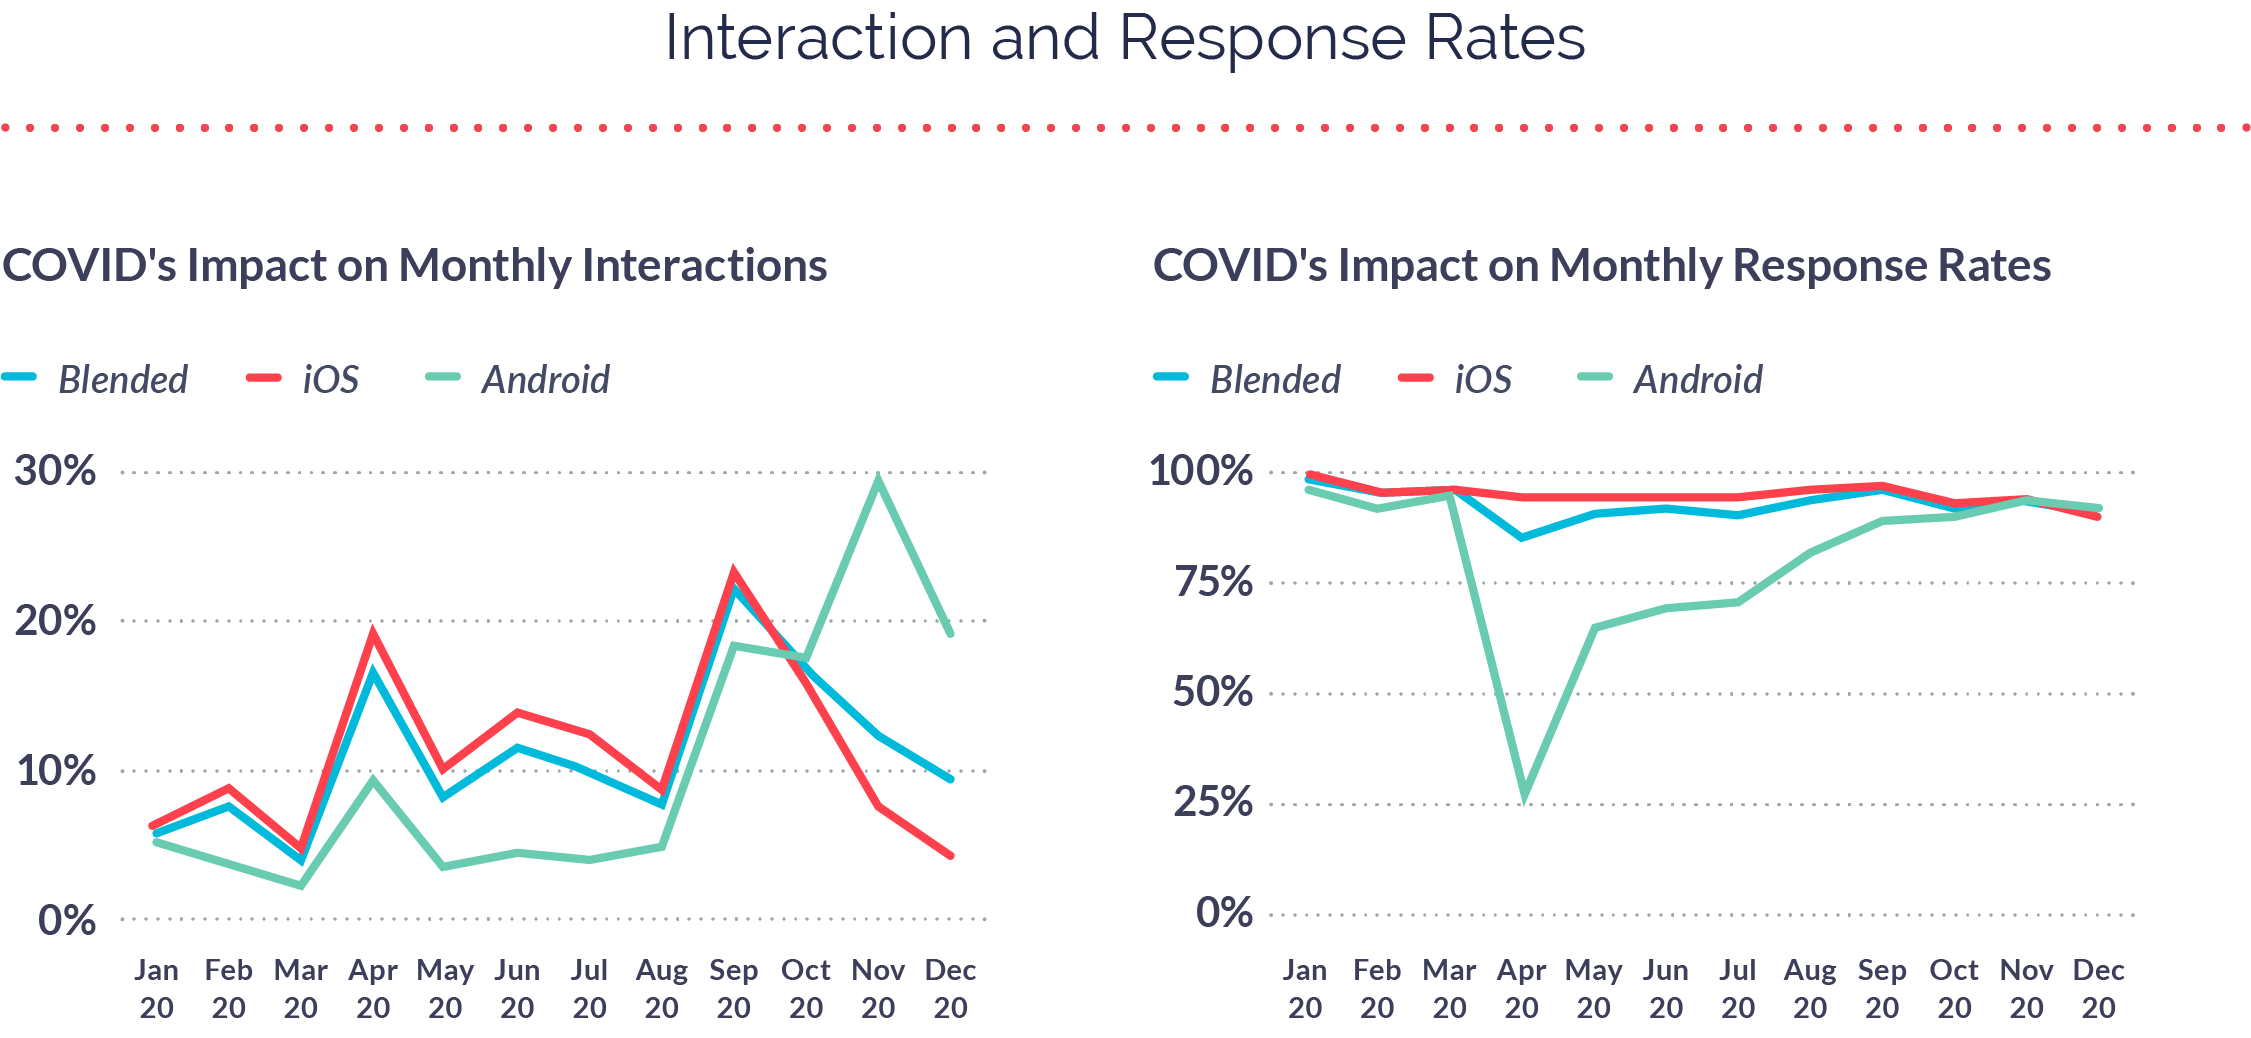
Education apps also experienced some of the most extreme MAU fluctuations starting in March and continuing throughout the year, which undoubtedly impacted their tech’s service reliability.
In response, consumers took to the app stores to express frustration, and the category’s average star ratings are below average on both iOS and Android.
But it wasn’t all doom and gloom. As you can see in the monthly response rates chart, Education apps who were able to proactively ask consumers for in-app feedback received a 94% response rate to their in-app interactions—higher than the macro average (92%).
Surveys and Messages
Mobile teams also expanded their segments of consumers to survey (50%) which resulted in incredibly high response rates to Note-linked surveys (82%).
The lesson here is consumers were eager to share feedback when they were asked for it, especially when it meant not leaving the app to do so. For brands who did this well, the feedback they gathered was able to help them fix bugs, adjust product roadmaps, and generally improve customer happiness.
Popular Phrases
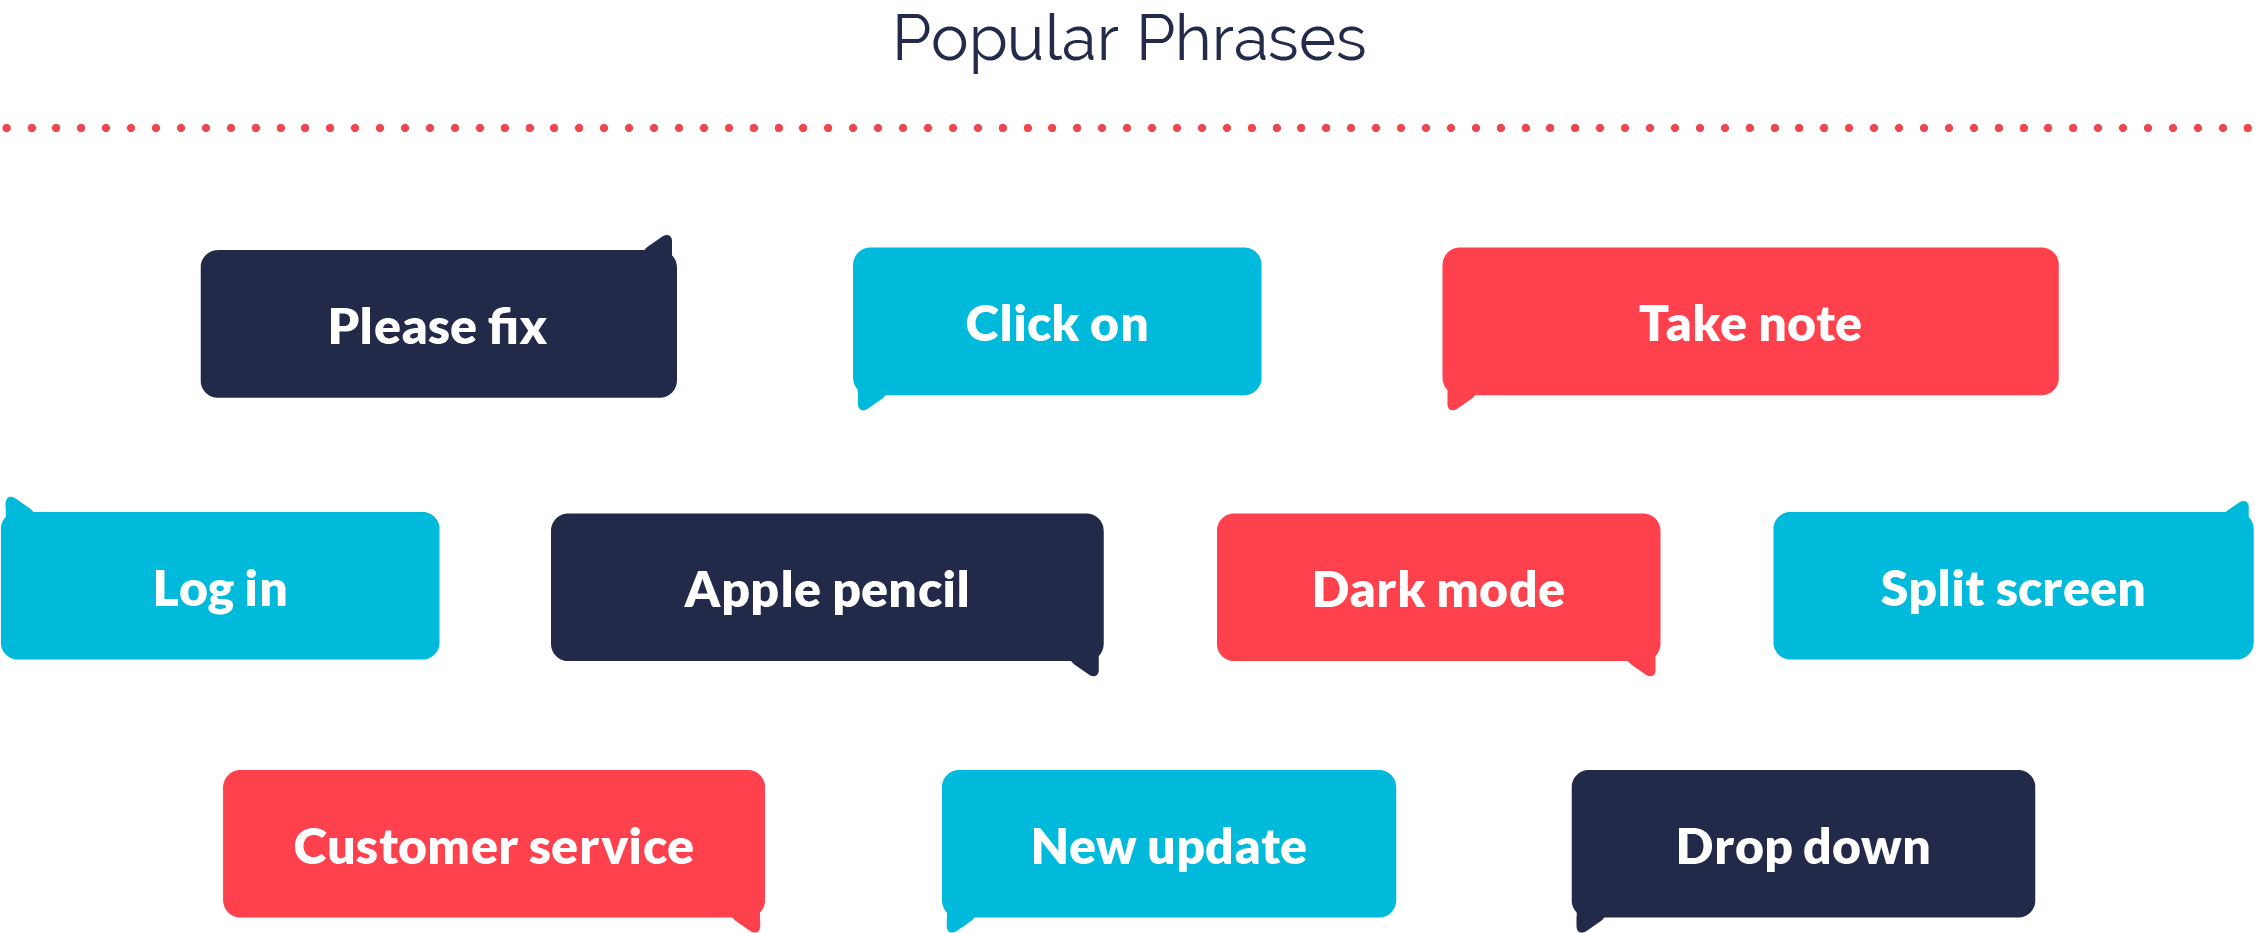
Shifting our focus to app store reviews, here are the 10 most popular phrases for both iOS and Android throughout 2020.
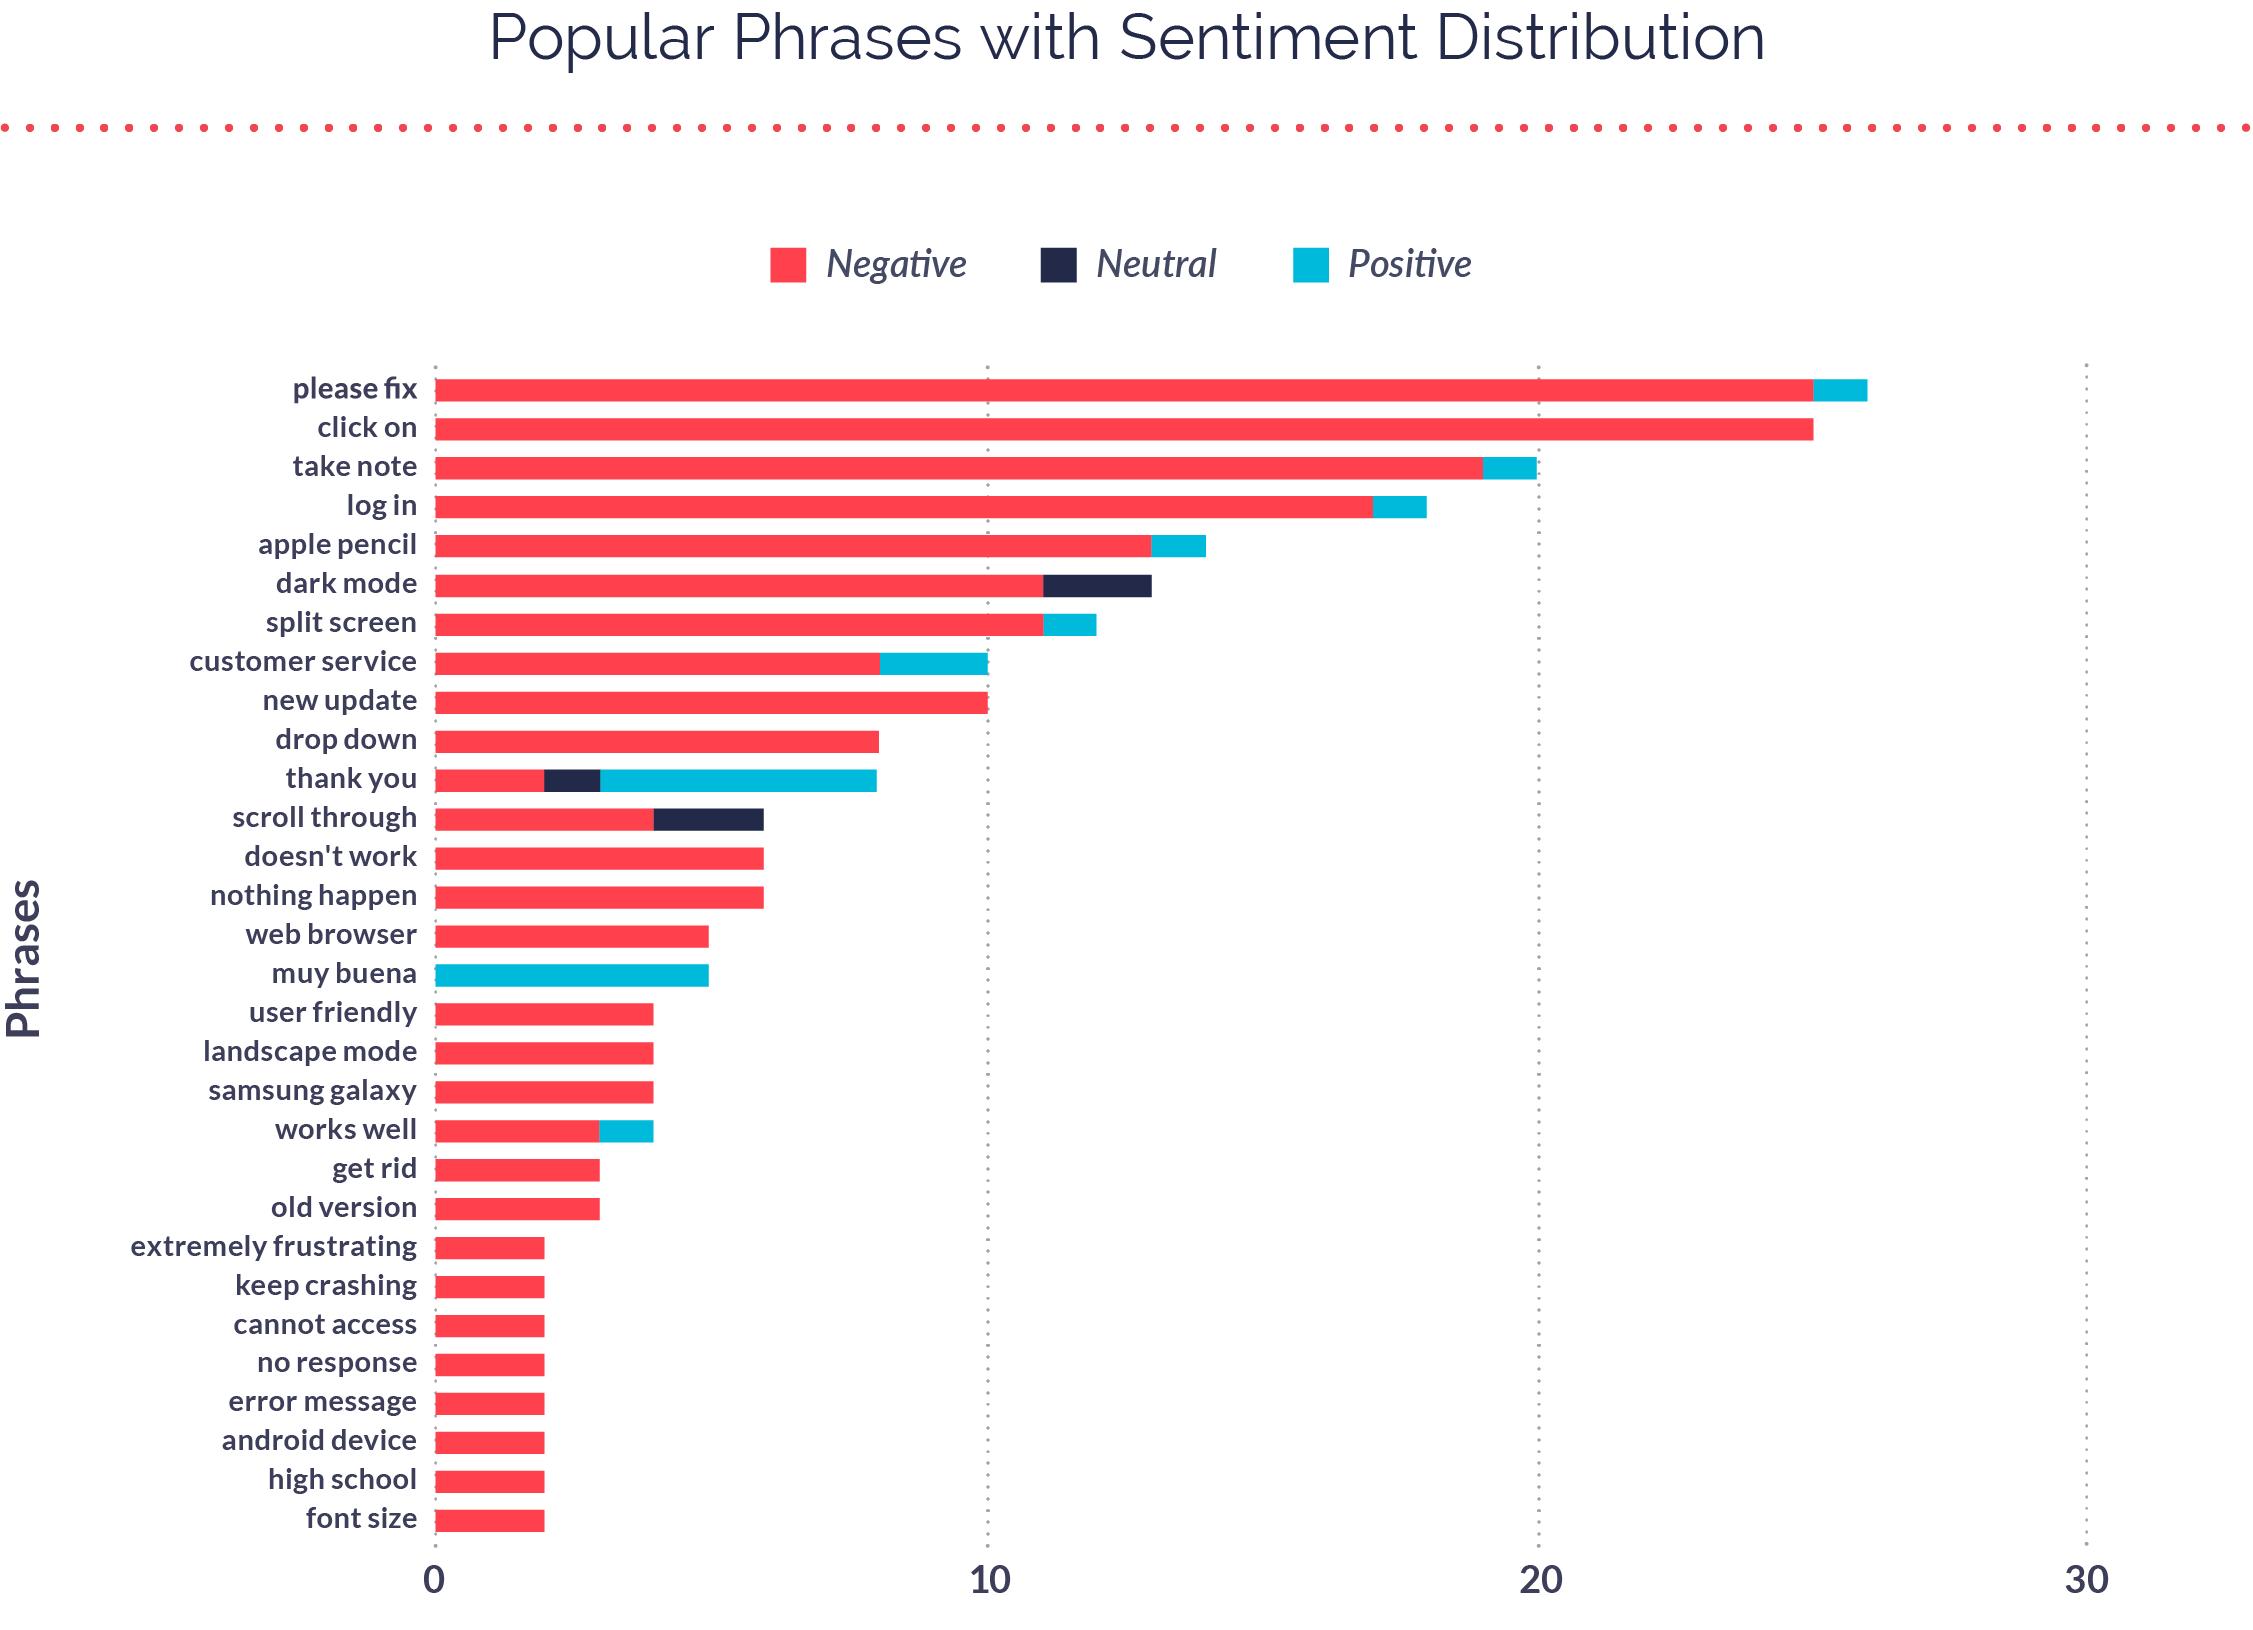
When we layer on sentiment distribution, you can see the difference between negative, neutral, and positive sentiment across app store reviews. The Education app category is especially prone to negative sentiment through reviews due to the nature of their business; it’s easy for consumers to leave frustrated feedback in the moment, and even easier for them to forget about positive experiences once they conclude.
Working in Mobile Education in 2021
Education apps in our study experienced significant change in consumer engagement, customer retention, daily active usage, emotion-based feedback, consumer interactions, ratings and reviews, and more. These changes were driven by a variety of unprecedented factors due to the coronavirus epidemic and generally had a harsh impact on the category.
For more on how mobile teams in Education can win back market share and improve feedback-based innovation, read our 2021 Mobile App Engagement Benchmark Report.


