What is a Perceptual Map?
A perceptual map is a chart used by market researchers and businesses to depict and understand how target customers view and feel about a given brand or product.
Perceptual maps can also be referred to as product positioning maps.
These useful charts allow organizations to understand their brand or product’s competitive positioning. They also allow for organizations to consider comparisons of attributes that are important to customers, and identify open areas within their markets.
In order to obtain the data that is plotted on a perceptual map, surveys are distributed to customers and potential customers that ask them about their experience with a product. These surveys ask about the respondents’ views on the product’s performance, packaging, price, size, and other variables.
Qualitative answers from the survey are then transferred to a perceptual map using a scale, such as the Likert Scale. The analysis of the chart is then used to inform product development and improvement.
What Does a Perceptual Map Look Like?
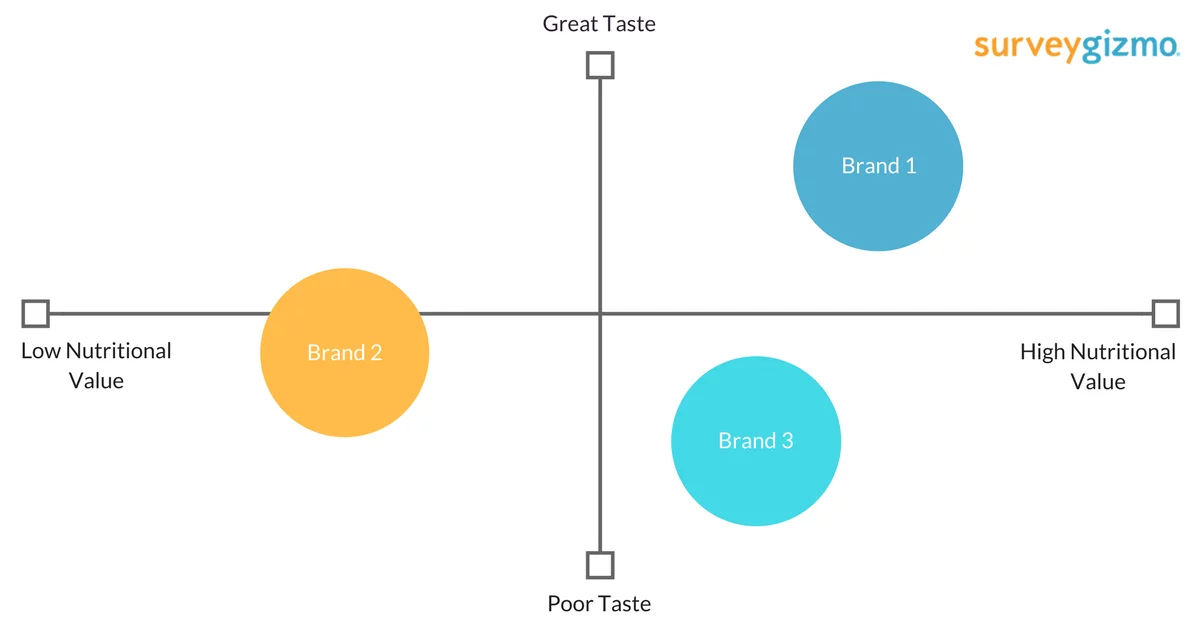
A typical perceptual map is a two-dimensional graph with a vertical axis (Y) and a horizontal axis (X). Each axis consists of a pair of opposite attributes at each end.
For example, if the map’s purpose is to investigate how consumers feel about breakfast cereals, the Y axis might have “great taste” at one end, and “poor taste” at the other. The X axis might have “low nutritional value” at one end, and “high nutritional value” at the other end.
Each cereal brand is then plotted on the perceptual map based on how consumers perceive the brand’s products relative to those attributes.
In order for a perceptual map to be as useful as possible, both the X and Y axes need to measure attributes that consumers actually consider while making purchasing decisions in the real world.
Again, the best way to begin to understand how customers and potential customers view the products and brands in a market is to survey them!
Types of Perceptual Maps
There are multiple types of perceptual maps. Simple maps like the one above represent just two variables, but perceptual maps can also be created using sophisticated multivariate factor analysis and statistical software.
Both simple and complex perceptual maps have their purposes.
The data required for simple maps can be collected more conveniently, which allows for quick insights. Alternatively, more complex maps consisting of three or more variables can uncover even deeper insights into the dynamics of a particular market, which allows for the identification of future growth opportunities.
How To Build a Perceptual Map
For the sake of simplicity, let’s continue with our breakfast cereal example.
Step #1: Select Your Determinant Attributes
Determinant attributes are the variables that the customer factors into their decision to purchase the cereal or not. These attributes will always be important to customers, as they help to differentiate competitive offerings in the market.
The best determinant attributes for your study will vary depending on your topic of interest.
If you just want to learn the basic dynamics of a market, it’s best practice to consider the attributes that are most important to the average consumer’s experience. This will entail some generalization, but that’s fine while performing exploratory research.
Remember that in this example we’re using health and taste as our determinant variables.
Step #2: Build and Distribute a Survey
In order to establish a significant dataset to work with, we’d need to build and distribute a survey to an audience that is relevant to our study.
Building and administering a survey in Alchemer is simple and straightforward, which will allow you to get to the actual perceptual mapping stage of your study faster.
In this case, we’d want to include questions that address the tastes and nutritional values of cereal products provided by competitors in the cereal market.
We could then leverage panel services to identify an audience of routine cereal eaters.
Step #3: Create Scores for The Brands in The Market
It’s time to start analyzing your survey response data. Pay particular attention to the differences in how respondents felt about cereals being offered by competing brands.
This data will often come in the form of qualitative data from some questions that are open ended in your survey. In these cases, it’s essential to create numeric scales such as Likert Scales, from which you can analyze long form responses and then assign the response a numerical value.
While considering our selected determinant attributes of health and taste, we would then need to provide each brand with a comprehensive score. This score represents how the average target consumer feels about the brand’s product offering.
Step #4: Create Your Perceptual Map
Once you’ve scored each brand, it’s time to build your perceptual map and plot the brands accordingly.
Staying true to the structuring discussed earlier in this post, our X axis will represent nutritional content, and our Y axis will represent taste.
Once we plot our brands accordingly based on their customer perspective scores, our perceptual map will be complete, and we’ll have an easily digestible data visualization to work with.
This theoretical perceptual map would look something like this:
Does your organization leverage perceptual maps to measure customer perception or to inform product development? If so, we’d love to hear from you! Drop us a line in the comments below.