
When they hear the phrase “survey design,” many users automatically focus on the textual content of their survey. Question phrasing, answer types, and all the words that make up a survey are, of course, vitally important.
But they aren’t the only language your respondents are reading.
In fact, all surveys are written in two languages: words and visuals.
Spending sufficient time on your survey format isn’t an optional piece of the survey design puzzle; it’s a crucial step that will help ensure a successful survey in two ways:
- Increase the likelihood that respondents will respond, and respond accurately.
- Make sure your visuals and your words are saying the same things.
The Importance of Visual Survey Design
It’s been clearly demonstrated in multiple studies that images, colors and the overall look and feel of a survey effect its outcomes. Relevant graphics and other pleasing visuals can increase a survey respondent’s positive feelings while filling out the survey, leading to increased completions.
Additionally, the “visual layout of a question may increase the likelihood that certain answers are chosen and others are not, or that some items are overlooked altogether” (Dillman et al, 2014).
Basically, if you’re ignoring visual survey design you may be unintentionally skewing your results.
If you’re attempting to engage your respondents with a conversational, chatty tone in your survey questions but maintain an out-of-the-box, stuffy visual style on your survey, respondents will pick up on the disconnect.
On the other hand, if you need to maintain a neutral survey taking environment to make sure you get accurate consumer opinions, you can’t use a color scheme commonly associated with one of the brands you’re asking about.
Basically, don’t confuse respondents by using text and graphics that speak in different voices.
3 Tools for Powerful Survey Formatting
Employ these three survey format tools correctly, and you’ll have eliminated a common area of error and made your survey more visually pleasing at the same time.
- Color. Determine your color story, and what impact this can have on your respondents.
- Branding and Images. Do you need a consistent brand message throughout the survey, or is complete brand neutrality required? How might your images be influencing respondents?
- Non-Question Text. Review the survey’s messaging, e.g. welcome page, buttons, error messages, and thank you page. Does it match that of your company and the survey as a whole?
Expanding your survey design to include colors, images and branding doesn’t have to be an immensely time-consuming undertaking.
With the appropriate survey tools, you can get the right look and feel with minimal effort (check out this guide to fonts and colors in survey design).
Survey Design Tool 1: Color
Do you have a color scheme in place for your survey? If not, it’s time to pick one (options are discussed below).
If so, how did you pick it? If you just left your survey in its default state, you will be best served by taking a few minutes to determine if this is really how you want your survey to look.
Apprehension about how to design a survey properly, as well as worry about how time-consuming it can be to implement a design, may be holding you back.
But there are some tried and true design tactics that you can employ to make sure you’re sending the right message with your survey’s visuals, and, as mentioned above, there are survey tools out there that should make getting those visuals in place a super simple process.
Establish a Principal Survey Color
When picking a color, consider its emotional impact, not just whether or not you personally like it.
If this is your survey design’s primary color, what feelings is it likely to evoke in your respondents?
Furthermore, ask yourself if you are looking to create a particular “feel” for your survey, or if neutrality is more important, and choose the color accordingly.
Some research seems to indicate that blue and yellow in concert may increase response rates over simple black and white, but in general it seems that using high contrast colors is more important than any particular color choice (Dillman, 2000).
Color Selection Guidelines
These are basic colors and common theories of each, but of course each one comes in many, many shades and tones:
- Red: A strong and dominant color. Red commands attention (only the color yellow is processed by the eye before red), but can become overwhelming or feel aggressive if overused. It’s internationally recognized as the color that symbolizes “stop,” but in Asian countries it’s also the color of good luck. A little bit of red goes a long way, so it may not be a good choice for a solo dominant color in most survey design.
- Blue: The most commonly given answer when people are asked for a favorite color, but it can also elicit the most complex and contradictory emotions depending on the shade. Using blue in your survey design can give respondents a feeling of trust, cleanliness, or dignity (European royalty is said to have “blue blood”). But it can also bring in negative feelings of sadness (“singing the blues” or “feeling blue”), so choose your blue hue carefully.
Yellow: The eye processes yellow wavelengths first, so this color will stand out on a survey, particularly if combined judiciously with black (think taxi colors). It can convey feelings of happiness and warmth, so it may not be a good choice for survey designs that want to stay neutral or professional.
- Orange: Just as orange falls between red and yellow on the color wheel, this color’s emotional impact is somewhere between that of red and yellow. It can convey strength without the aggression of red, or warmth without the frivolity of yellow. However it tends to be a polarizing color: most people either love or hate orange. Like red, it’s most effective when used in strategic combinations.
- Black: The negative connotations of black are pretty well known. It’s commonly associated with death, decay or darkness on its own. However, when combined with secondary colors it can read differently. Black and gold can create the impression of luxury, while blacks and gray or silver in combination may represent sophistication.
- White: Typically viewed as the opposite of black, white can represent cleanliness, health and vitality. Too much unbroken white may start to appear sterile, but a white-centric survey design can read as modern, streamlined and neutral if used with the proper accent colors.
- Purple: Commonly associated with royalty, purple connotes luxury. Reddish purples may evoke feelings of romance or intimacy, so like yellow it may not be a good choice of a predominant color for a survey aiming for a professional look and feel, but it can be a good color for establishing rapport with respondents.
- Green: With its connotations of Spring growth and rebirth, green can be a solid choice for a survey color. The flip side of the green color story is its associations with jealousy, so a subdued or muted green may be your best option.
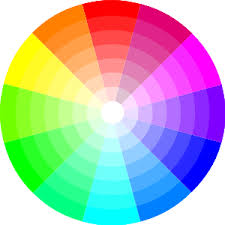
Choose Your Survey Color Story
Color theorists have done most of the leg work for us here. If you can just establish one main color for your survey you can use these established color-wheel combos to pick the others.
- Complimentary: This is one we all learned in elementary school. Complimentary colors are opposite one another on the color wheel. Example: Blue and orange.
- Split Complimentary: Instead of choosing the color directly across from it on the color wheel, this scheme takes the two on either side of it.
- Analogous: Three colors right next to each other on the color wheel.
- Triad: Three colors that are evenly spaced across the color wheel.
- Square: Takes four colors that are evenly spaced around the color wheel. This scheme works well with one strong and three muted colors.
- Tetradic: these schemes are built by creating a rectangle on the color wheel. Select two opposites on the color wheel and then select another color two spaces over and its compliment across the color wheel.
Check out examples of all these schemes on Sitepoint’s Color Theory page.
Creating Accessible Surveys
Regardless of the colors and color scheme that you select, make sure that your survey will be accessible to those with different visual capabilities.
- Don’t rely exclusively on color to convey meaning. As we’ve seen, color can play a strong role in enhancing your survey, but its meaning needs to stand alone for respondents who can’t see those colors.
- Make sure all images have captions or alternative text. If a user can’t see the image, they can at least hear a description of it.
- Use high contrast colors. Those respondents with visual impairments will be able to parse the contents much more easily, and, as mentioned above, contrasting colors may even increase response rates for users without visual difficulties.
Survey Design Tool 2: Logos and Branding
This is listed here as the second of three survey design tools, but in reality if you know from the start that you want to use your company’s brand throughout your survey design you can probably skip most of the color selection process.
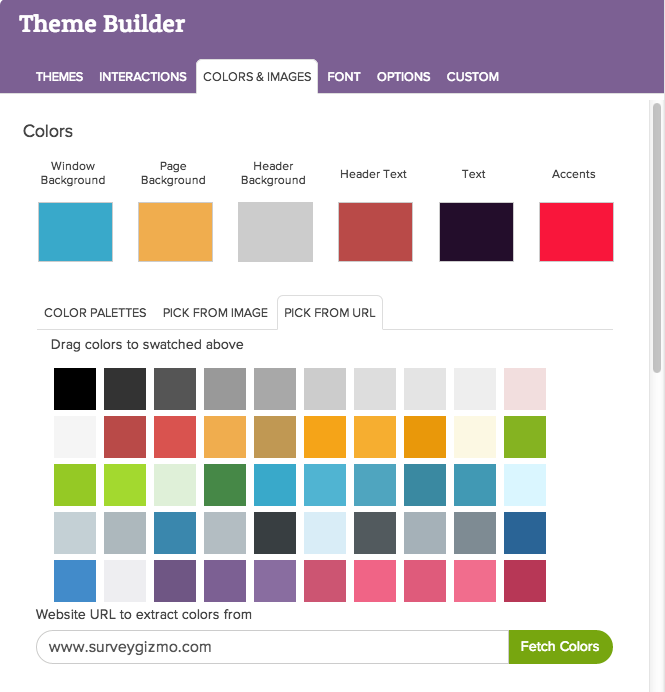
If you know you want your survey to mirror the color scheme of your website or logo, for example, all you need to do is grab those colors and drop them into your survey.
You should be able to use the formatting tools in your survey software to incorporate those colors seamlessly.
Whether it’s importing the CSS files from a particular URL, using a color picker tool or typing in the hex codes for your corporate colors, the right tools will complete this part of the process in moments.
Keep in mind that however important branding is to you or your client, it shouldn’t interfere with user-friendly survey design in general.
Want your logo front and center? That’s great, but “respondents should not have to scroll past a logo that is included only for branding purposes in order to enter their access codes and move on to the next screen” (Dillman et al, 317).
Visual Survey Design That Avoids Bias
Similarly, if you want to strip your brand off of a survey having the right tools is vital. You need to have complete control over all aspects of the survey to make sure that you’re maintaining a neutral tone throughout.
If you’ve carefully crafted your questions to make sure your respondents aren’t being influenced by pre-existing notions about particular companies only to have persistent theme elements that mirror one brand’s corporate identity, you’re doing your data a serious disservice.
The right survey design tools will not only let you keep your brand (and the emotions its colors and images evoke) front and center when appropriate, they will also facilitate a neutral survey format as needed.
Finally, a fully customizable survey tool will make the inclusion of appropriate images a painless process, but once again a judicious eye is necessary; images can significantly impact how people answer questions.
Studies have shown that when shown an image of a sick person, for example, users tended to rate their own health as better. But when an image of a healthy person was on the survey, their answers about their own health were more negative (Couper, Conrad & Tourangeau, 2007).
Survey Design Tool 3: Non-Question Text
Finally, make sure that you’re not neglecting non-question text within your survey. Forward and back buttons, welcome/thank you pages and error messages all need to maintain a consistent tone with the rest of your survey.
The Importance of the Welcome Screen
Pay particular attention to your welcome screen, the one that signals the beginning of your survey.
This signals to respondents that they’re in the right place, “and for many ambivalent respondents it is where they either make a commitment to start the survey or decide against doing so” (Dillman et al, 315).
If you want to create a friendly, chatty tone in your survey, this is where to establish it. Conversely, if your survey requires a more professional distance, create that with a customized welcome page and maintain it with your survey design throughout.
Customizing Survey Error Messages
Error messages can also be particularly jarring survey points if left uncustomized.
Providing very specific information about what went wrong and how the respondent should proceed will dramatically decrease the likelihood that they will abandon the survey. These messages should be consistent with the overall survey format and design, including any logos or branding.
Choose the Right Tools For Styling Your Survey
As with importing colors from a site or image, having the right customization tools is vital for achieving your survey design goals.
Lower-tier software may not give you the option to change button text, size, font, or color, or it may require complex and time consuming CSS customization.
The right survey software will give you complete control over the experience that your respondents have in every corner of your survey.
Survey design extends well beyond the textual content of your questions. Color, branding and non-question text are all influential aspects of your survey format that require attention and consistent formatting.
Make sure you have the right tools in place, and the visual half of your survey will work in seamless harmony with the text.
Resources:
Couper, Mick P., Frederick G. Conrad, and Roger Tourangeau. 2007. “Visual context effects in web surveys.” Public Opinion Quarterly, 71(4): 623-634.
Dillman, Don, Jolene D. Smyth, Leah Melani Christian. Internet, Phone, Mail, and Mixed-Mode Surveys: The Tailored Method Design, Fourth Edition. John Wiley & Sons, 2014.
Dillman, Don. Internet, Phone, Mail, and Mixed-Mode Surveys: The Tailored Method Design, Second Edition. John Wiley & Sons, 2000.