
What is a Sampling Distribution?
A sampling distribution is a probability distribution of a statistic that is obtained by drawing a large number of samples from a specific population.
Researchers use sampling distributions in order to simplify the process of statistical inference.
When to Use a Sampling Distribution
Let’s imagine that our population of interest is comprised of a hat filled with raffle tickets. Each raffle ticket has a number printed on it, one through five.
For that population, we could calculate standard parameters such as the population mean or the population standard deviation. Or, we could instead create our own parameters to investigate such as examining the proportion of the raffle tickets that have odd numbers printed on them.
But in reality, researchers aren’t always able to know or find their population parameter of interest with confidence. When this is the case, these researchers must estimate.
In order to estimate a population parameter, researchers take a sample of size n from the population of interest. They can then calculate a statistic from the sample that can be used to estimate the parameter.
However, because the sample being used is truly random, the researchers must note that the statistic calculated for the specific sample might not be exactly the same as the original unknown parameter of interest.
This means that if the process was carried out again, and another random sample of size n was taken from the population, it is possible that the calculated statistic holds a different value than the calculated statistic that resulted from the first iteration of the process.
This leads researchers to ask, “What is the frequency with which we can get different values for the statistic that is trying to estimate this parameter?”
The distribution that the researchers are inquiring about here is known as the sampling distribution.
How to Build a Sampling Distribution
Setting The Stage
Let’s go back to our original example of the hat full of raffle tickets.
If our population parameter of interest is the population mean, we would simply calculate 1+2+3+4+5, and divide the result by five. Our population parameter here would be three.
If we wanted to take samples from this population of five raffle tickets, we could take two tickets out of the hat at a time. Our n here would be two. Each time a raffle ticket is removed from the hat, it is replaced by a new raffle ticket.
We’ll use the sample of two raffle tickets at a time to estimate the population mean.
For example, in our first sample of two tickets let’s say that we pulled a raffle ticket with a three on it, and a raffle ticket with a four on it.
We could use this sample to estimate the population of interest, in this case the mean of the population. Here our sample mean would be 3.5.
If we were conducting thorough research, it would be best practice to carry out this process multiple times. The next time around, let’s say we pull raffle tickets with the numbers three and five. In this case, our sample mean would be four.
By creating just two samples, and using those samples to estimate the greater population mean, we have already received two differing estimates — first an estimate for a population mean of 3.5, then an estimate for a population mean of 3.5.
There are lots of possibilities in terms of the outcome that will result from pulling two raffle tickets out of the hat. Because the raffle tickets are being replaced once we pull them, the possible results would look like this:
| # on Raffle Tickets Picked | Sample Mean |
| 1, 1 | 1 |
| 1, 2 | 1.5 |
| 1, 3 | 2 |
| 1, 4 | 2.5 |
| 1, 5 | 5 |
| 2, 1 | 1.5 |
| 2, 2 | 2 |
| 2, 3 | 2.5 |
| 2, 4 | 3 |
| 2, 5 | 3.5 |
| 3, 1 | 2 |
| 3, 2 | 2.5 |
| 3, 3 | 3 |
| 3, 4 | 3.5 |
| 3, 5 | 4 |
| 4, 1 | 2.5 |
| 4, 2 | 3 |
| 4, 3 | 3.5 |
| 4, 4 | 4 |
| 4, 5 | 4.5 |
| 5, 1 | 3 |
| 5, 2 | 3.5 |
| 5, 3 | 4 |
| 5, 4 | 4.5 |
| 5, 5 | 5 |
Plotting The Points
We could then plot the frequencies of these possible sample means. This plot would be a sampling distribution of the sample means.
Since the sample mean will be between one and five, those numbers are plotted on the x-axis. Since there are 25 possible outcomes when pulling two of the raffle tickets out of the hat, the frequency of each outcome is then plotted on the y-axis accordingly.
This sampling distribution for the sample mean for a sample size of two would look like this:
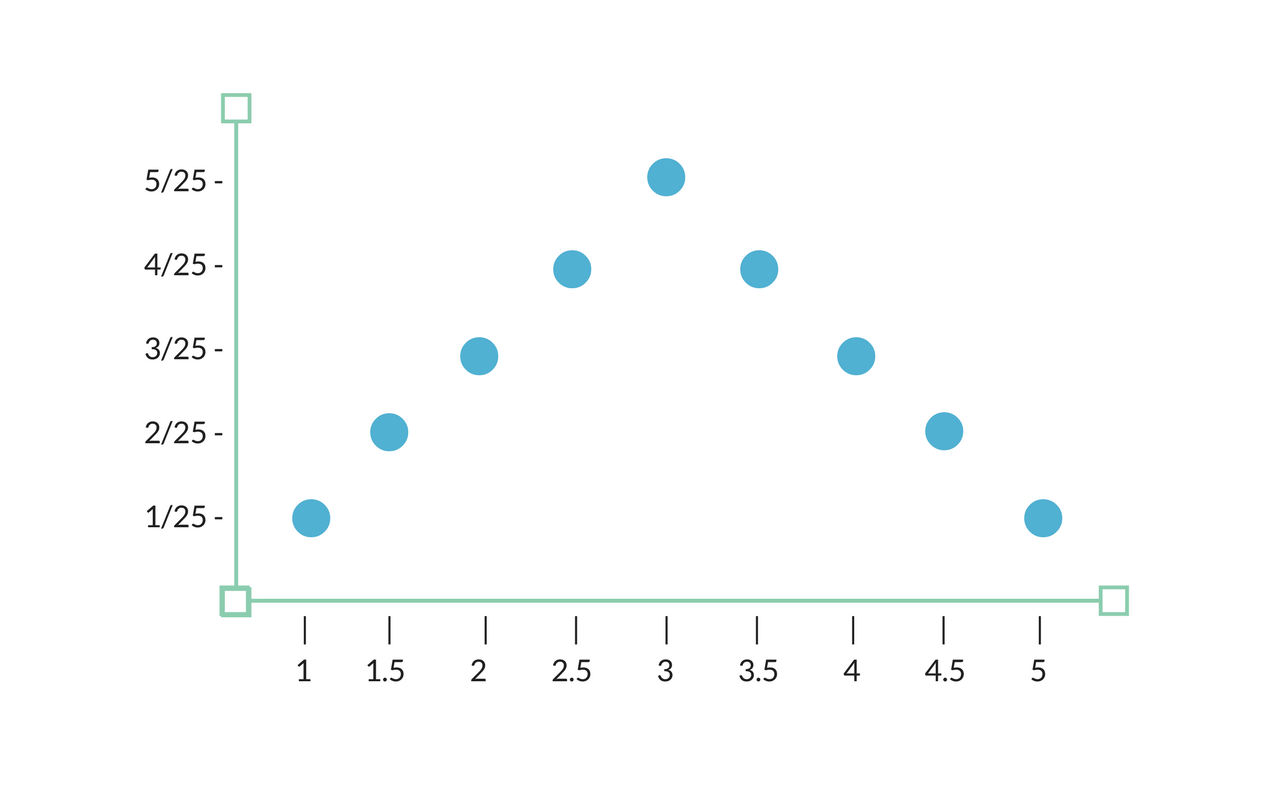
The frequencies on the y-axis here appear as fractions. This is communicating that when we take a random sample with replacement of two raffle tickets, we have a X in 25 chance of having the sample mean communicated by the x-axis.
Conclusion
Sampling distributions are effective tools used by researchers to make estimates and inferences about a larger population of interest based on the data that they have access to.
These sampling distribution data visualizations allow researchers that leverage them to make precise inferences, and establish a stronger grasp on the understanding of a population in general.
Have you used sampling distributions in your research to better understand a population? If so, we’d love to hear your story. Feel free to drop us a line in the comments below!