As curious humans, we have a desire to make sense of data we are presented with each and every day. As professionals in the many-sphered world of business, we have an outright need to take this desire further, to categorize and quantify this data in order to successfully carry out campaigns and (hopefully) turn profits.
This is where the universal language of Data Visualization comes in to play.
How Data Visualization Makes Learning Simplified
In a time when data is being generated at higher volumes than ever before, business professionals are increasingly searching for the best ways to compile this data and present it in a way that is engaging and easy to understand. This begets the question: what is the most user-friendly way to interpret data?
Would we want to analyze this data in a 20 page, text only report? Chances are, you answered that question with an emphatic NO (and its safe to say you’re not alone in doing so).
This is why the professional world has placed an increased focus on Data Visualization (DataViz for short) in recent years.
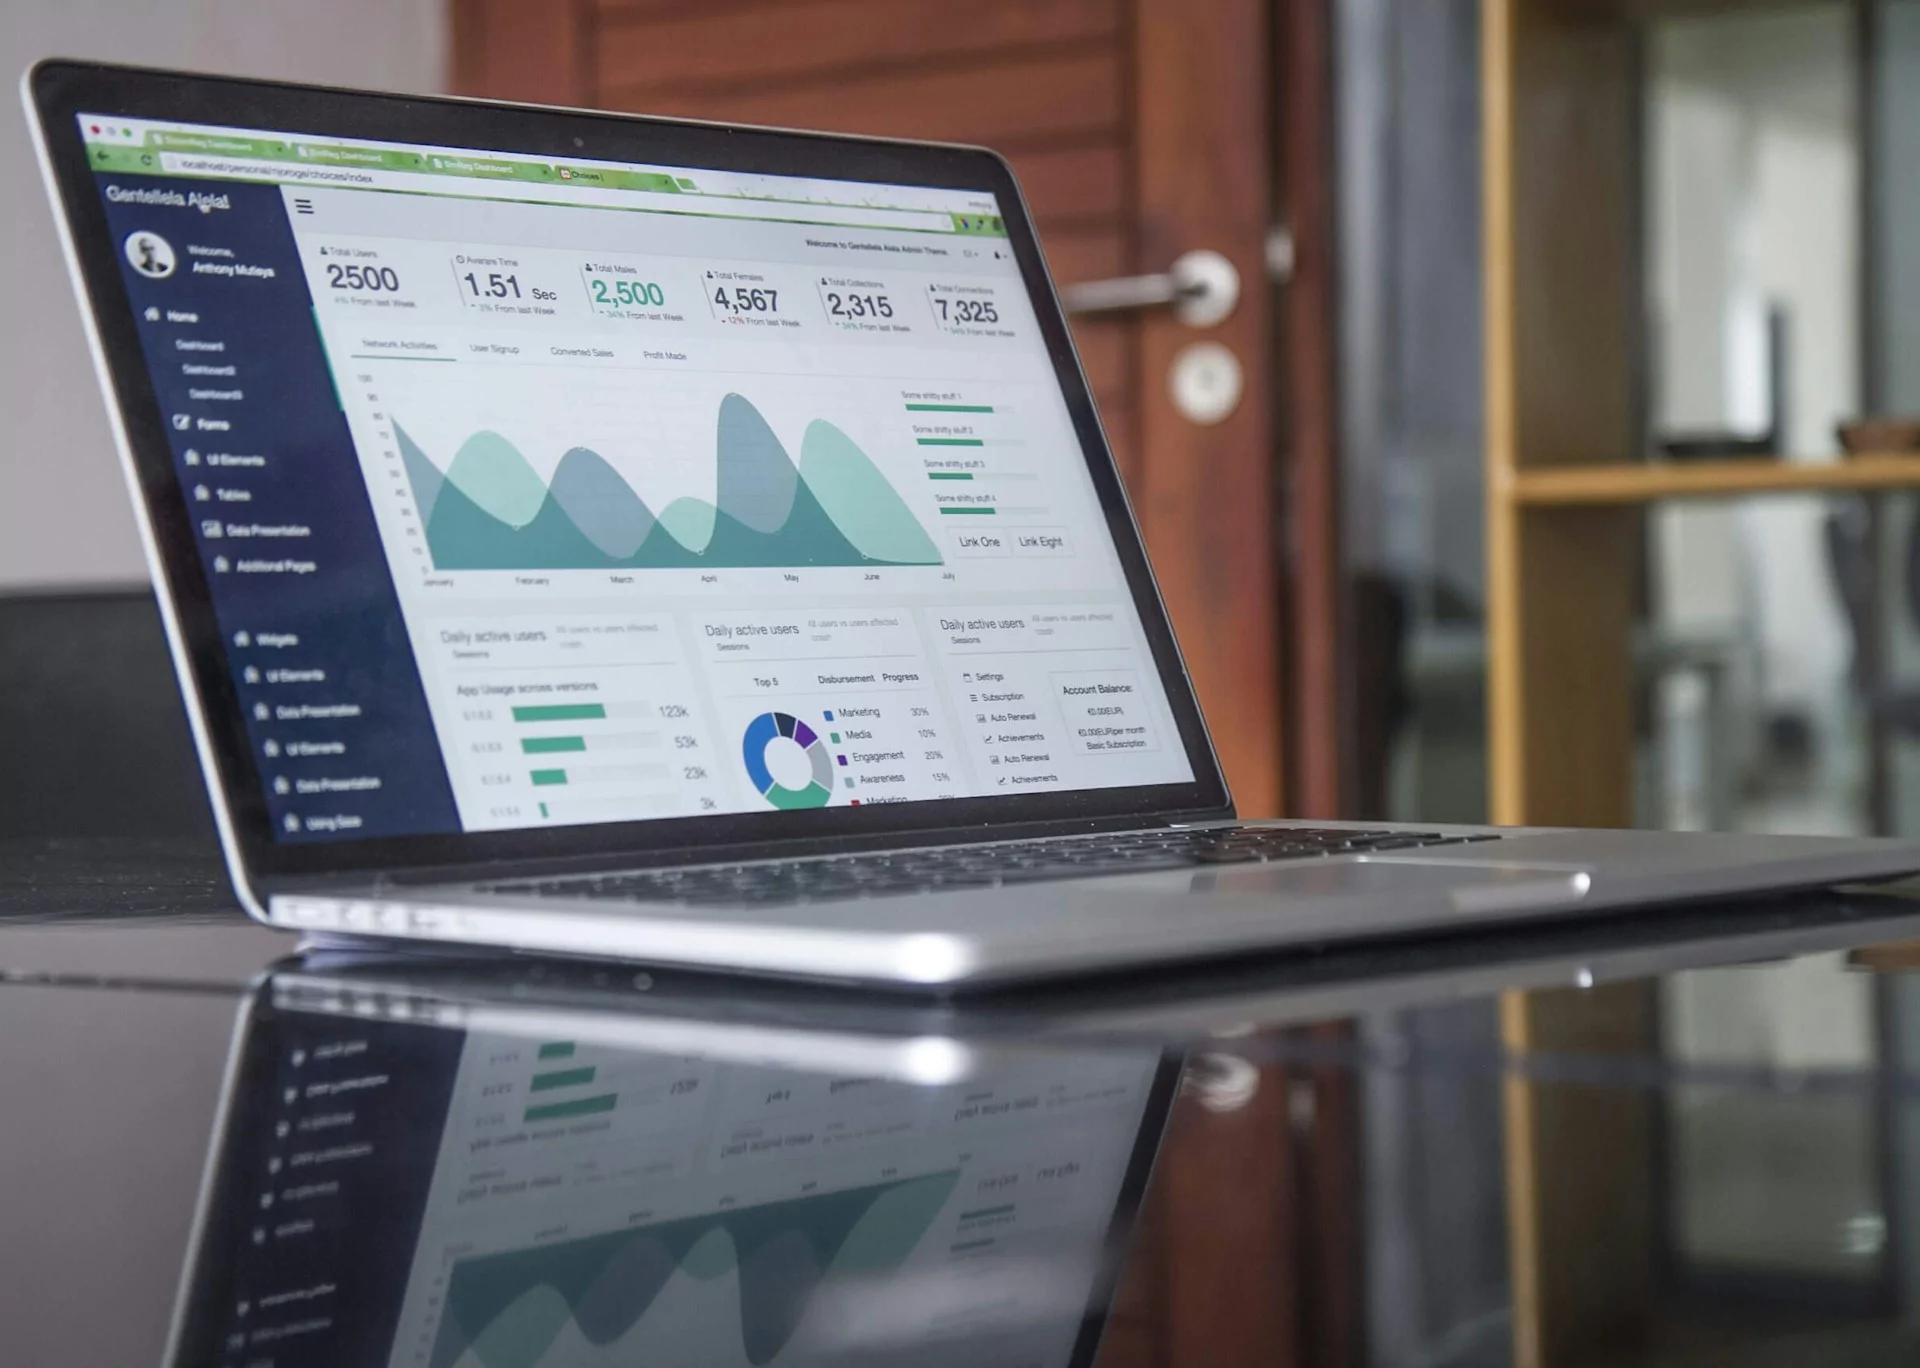
DataViz, and the various components that comprise its makeup (charts, graphs, icons, diagrams etc.), allow us to compile, process and retain information in a manner that is engaging, and above all, easy to understand.
More importantly, if done right, DataViz allows the data to tell the story itself with little outside explanation.
Infographics: The Language of The Modern Business Landscape
“Charts, graphs, maps, diagrams – even animated GIFs and emojis – all transcend text, spoken languages, and cultures to help people understand one another and connect,” says Harvard Business Review Editor Scott Berinato.
In his book, Good Charts: The HBR Guide to Making Smarter, More Persuasive Data Visualizations, Berinato goes on to call DataViz “business’s new Lingua Franca,” further stating that “visualization is probably the best way to help people grasp information efficiently.”
In other words, seeing not only lets many of us believe, but understand and perform critical analysis as well.
Breaking The Language Barrier And Bettering Your Visual Storytelling
While we all absorb information through visualization on some basic level, becoming fluent in the specific language of Data Visualization in the workplace is a skill that must be learned in order to thrive in the modern business world. We are routinely taught to take in data and process it within our heads, but less frequently do we learn how to actually communicate to the world around using this data.
It’s a hump that some find intimidating to get over at first.
“(Speaking with data can be) scary, because without a clear path to follow, our best intentions and efforts (combined with oft-questionable tool defaults) can lead us in some really bad directions,” says author Cole Nussbaumer Knaflic.
In her book, Storytelling With Data: A Data Visualization Guide For Business Professionals, Knaflic highlights these issues and more, but also makes sure to reinforce the idea that it is not only possible to break the language barriers holding many back from skillfully communicating with DataViz – anyone can do it with the proper guidance and tools.
“This is an intimidating place for many, but it does not need to be,” says Knaflic. “The skills that are needed in this area are fundamental. They are not specific to any industry or role, and they can be effectively taught and learned.”
The Six DataViz Commandments
Knaflic goes on to provide readers with six basics steps to becoming fluent in communicating DataViz:
- Understand the context of your data
- Choose an appropriate visual display
- Eliminate clutter (and not just in the living room)
- Focus attention where you want it
- Think like a designer
- Tell a story
Once we are able to assess our data and approach it using these steps, DataViz literacy ceases to be just a possibility and becomes an inevitability.
Using Data Visualization To Go From Participant To Competitor
Learning to efficiently communicate with data visualization has been considered a beneficial skill to have in the workplace for some time; but in today’s hyper-competitive business environment, it has moved from beneficial to flat-out necessary.
“An effective data visualization can mean the difference between success and failure when it comes to communicating the findings of your study, raising money for your non-profit, presenting to your board, or simply getting your point across to your audience,” says Knaflic.
Furthermore, it is rapidly becoming an expectation to be able to communicate with DataViz efficiently and fluently.
“No company today would hire a manager who can’t negotiate the basics of a spreadsheet; no company tomorrow will hire one who can’t think visually and produce good charts,” says Berinato. “DataViz has become an imperative for competitive companies.”
Data Visualization literacy should be a top priority for any organization, but particularly companies directly swimming in the Big Data sea.
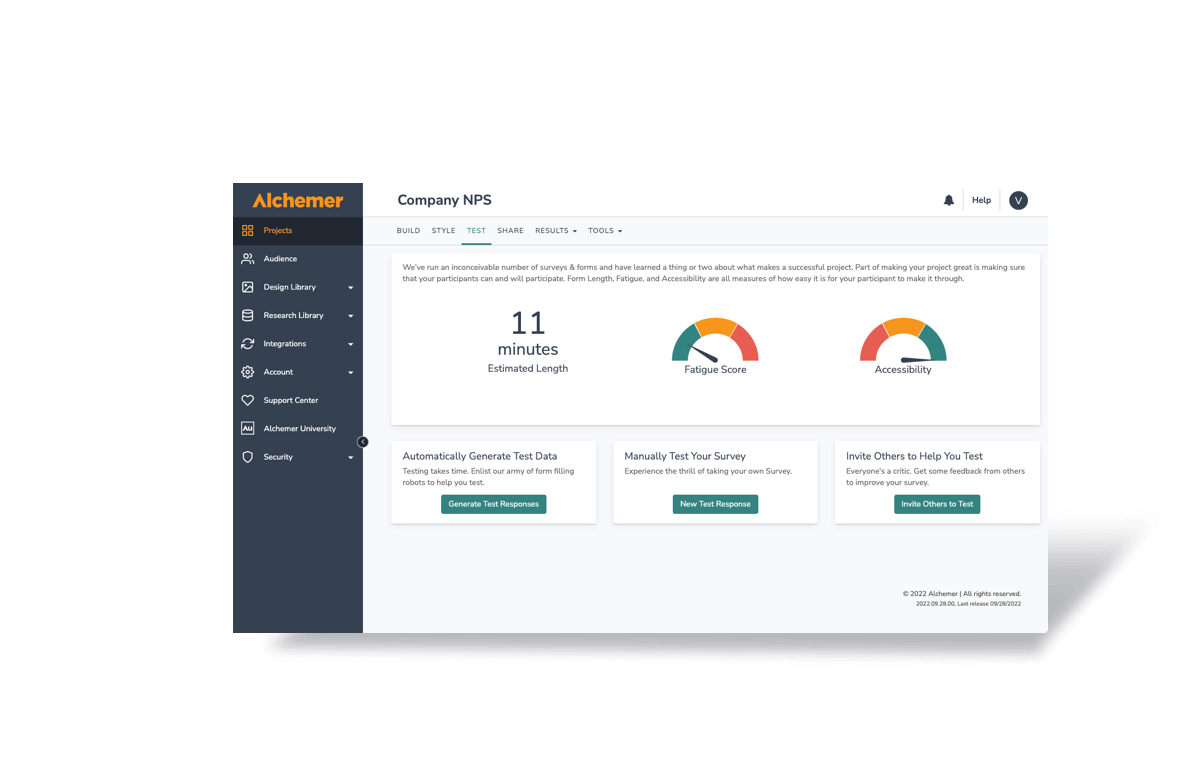
“Being able to categorize and convey data to both employees and customers is essential for any data-based company,” says Christian Vanek, CEO of Alchemer. “It’s not good enough to just show the data – it has to presented in a way that is clear and easy to retain the information at hand. In a way that makes the user excited to learn about what is being presented. That’s the basis behind the Alchemer user interface, and that’s why we perform at the level in which we do.”
The Future of Big Data Communication is DataViz
DataViz has staked its claim as one of the most important skills in the modern business world, and shows no signs of going away any time soon. By familiarizing ourselves with this language, and being proactive in its use and fluency, we can bring a razor-sharp precision to the business landscape that elevates our work from engaging, to eye-popping.
If you would like to read more about the importance of Data Visualization in today’s business environment, please look into the books quoted in this article:
Good Charts: The HBR Guide to Making Smarter, More Persuasive Data Visualizations – Scott Berinato
Storytelling With Data: A Data Visualization Guide For Business Professionals – Cole Nussbaumer Knaflic


