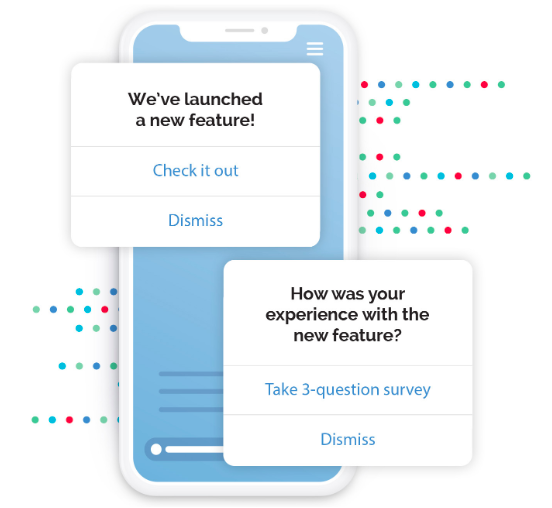
Surveys enable companies to collect and analyze both qualitative and quantitative feedback. Mobile surveys are powerful in understanding sentiment, but only if they’re used correctly. When it comes to mobile, short surveys with specific asks (like feedback on a new feature) are effective and efficient.
In addition to content, timing of surveys is critical. A survey that interrupts a customer’s in-app experience will rarely be well-received. The data in this post shows us how winning brands design in-app surveys for great customer feedback flows.
Mobile Surveys Sent + Response Rates
In 2019, apps sent 44,849,700 consumer surveys, which is a 29 percent increase from 2018. The most surprising (and satisfying) finding is that even with the year-over-year increase in the number of surveys sent, the survey response rate held steady at 18 percent compared to 2018’s 19 percent.
Another important distinction is that, on average across industries, brands only hear from ~1 percent of their customers surveyed. With 1 percent as the baseline, an 18 percent response rate is off the charts. The large increase in surveys with a steady response rate is due to sending in-app surveys at the right mobile moment, coupled with intelligent survey questions.
Mobile Surveys and Notes
To understand how surveys with the highest response rates are being delivered to end-consumers, we have to look at how they are triggered. While the above response rates are much higher than the 1 percent cross-industry average, there is a segment of surveys that boast an even higher response and completion rate: Note-linked surveys, or rather, surveys that are linked to using an Alchemer Mobile (formerly Apptentive) Note.

In 2019, the average response rate for a Note-linked survey was 54 percent. iOS apps saw a 50 percent response rate, and Android apps saw a 62 percent response rate. You read that right: At least half of all end-consumers across both operating systems responded to Note-linked surveys. Again, the baseline for in-app survey response rates is around 1 percent across industries.
What this data tells us is that if you give your customers a choice in giving feedback rather than simply requesting it, they’ll be more open in giving it to you. Using a Note to link to a survey can be a softer way to encourage feedback, and it’s clear that winning brands capitalize on it as an option.
Net Promoter Score Surveys
Net Promoter Score is still an important political number, but it’s a method of measuring customer sentiment that falls on a flat scale. Over 150 S&P companies cited NPS in 2018 earnings calls. Bonuses are based on it. Millions of dollars are spent managing it. Every industry captures it. But we see NPS alone as a vanity metric that does not give you the “why” behind customer emotion—the thing you must act on in order to affect change.
Another common mistake with NPS is that it is not prompted in a timely manner. For example, many brands prompt NPS long after an experience has concluded, via email, SMS text, or web survey rather than in their app. This lag does not provide a cohesive in-app experience, and does not allow brands to close the loop with detractors with a note or conversation to understand the emotion behind their sentiment.
But aside from how we at Alchemer Mobile (formerly Apptentive) feel about NPS, we know it’s still important to our customers. To dig into the data, we’ve broken NPS out separately from the previous surveys section.
The average NPS for Alchemer Mobile (formerly Apptentive) customers in 2019 was +25. For iOS apps, the score was +28. For Android apps, the score was +21.
The 2019 results are likely lower than you might expect as a “good” score typically falls between +40-50, depending on your industry. But we aren’t surprised. At Alchemer Mobile (formerly Apptentive), we advocate for our customers to run non-biased surveys over NPS in order to truly dig into customer emotion driving sentiment. The +25 score is lower than average because it’s realistic; our customers don’t just target their fans in order to get a high result.
Lower scores are never fun on paper, but it’s better to look at customer emotion holistically than in a vacuum. We don’t want our customers gaming the system by inflating NPS because ultimately, they don’t gain anything from it. You cannot act on emotion you haven’t collected, and NPS doesn’t tell us a thing about what drives customer emotion and why.


