
Your audience’s attention is a finite resource. Wouldn’t it be nice to know what’s catching their eye?
Sure, you can show them a picture of your product or website and ask for feedback, but collecting this kind of feedback through short or long answer text boxes can be complicated and difficult to verify.
The solution is to use our new heatmap question type.
Let’s take a look at when to use heatmap questions and how to set one up in your survey.
What Are Heatmaps?
Heatmaps are one way for researchers to find out what their audience sees, and how they react to it in a much more precise way.
In a live survey, the question type presents your survey respondents with an image and prompts them to click on different parts of that image to provide feedback or reactions.
You can see this illustrated in the gif below.
This survey designer asked for respondents to provide feedback, both positive and negative, on the Alchemer homepage. Respondents click on an area of the homepage, select the category of their reaction (Like or Dislike), then type a few words to explain why.

Survey creators can customize the reaction categories, allowing them to collect only certain kinds of feedback (for example, only looking for what the audience doesn’t like), or customizing the categories themselves (ex: Love, Hate, Don’t Understand).
Creators can also choose whether or not to include a text box for further comment.
How Does Heatmap Data Report?
In your reports, heatmap data could get confusing, so we’ve organized responses to be as easy to digest as possible.
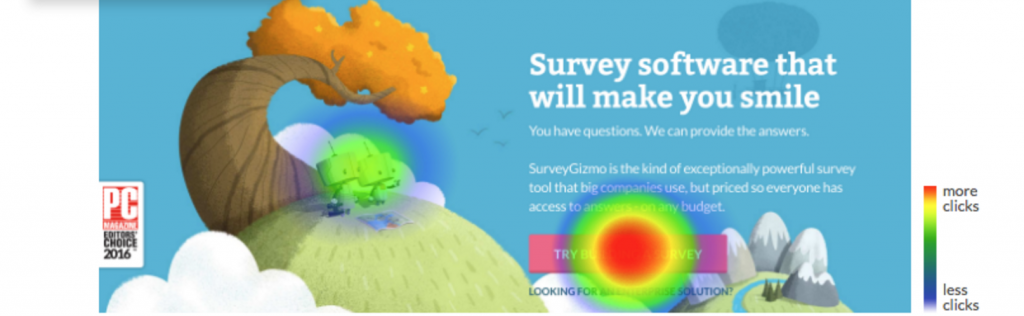
The first thing you’ll notice about a heatmap reporting chart is the image. The colored shapes on the image are a visual representation of where people clicked.
Bright red represents a greater concentration of clicks, which means more people are reacting to that area, while dark blue represents a lower click concentration.
In this example, note the concentration of color over the pink “Try Building A Survey” and the lighter green heatmap over the robots.
This means the pink button received the most clicks, while a few people also clicked on the robots.
Using the drop down menu above the visual heatmap image, you will be able to toggle between the response categories (in this case, Like and Dislike). Only one category is displayed at a time, and the eye icon lets you know which option you are viewing at any given moment.
Toggle the visual heatmap to compare which areas were reacted to in which ways.
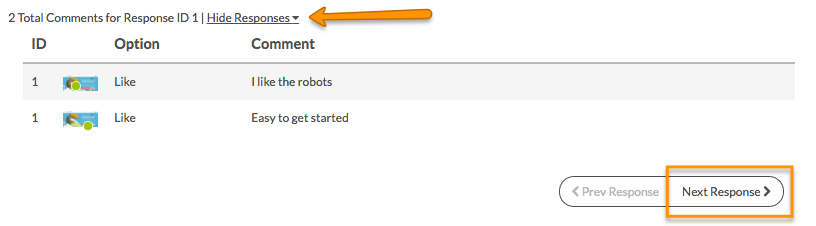
To view the text comments, if your survey builder enabled that feature, click the “View Responses” option. All text feedback will be displayed, organized by response category, just like the visual heatmaps.
Why Should I Use Heatmaps in My Survey?
Capturing a person’s interest is more important – and more difficult – than ever before.
Designers and developers can also use this question type to determine how a user’s eyes are moving on a webpage or graphic. With heatmaps, you can answer the age old question: “Are people even looking at my banner ads?”
The responses you collect may surprise you.
But you won’t know unless you use heatmaps to determine what is really going on in your audience’s mind.
As in the examples above, heatmaps can be used to get audience feedback on web design, pinpointing exact locations and features that your potential customers like and dislike.
It can also be used with images representing things like product interiors, product exteriors, graphic designs, and even photographs or artwork to give feedback on composition.
Without a heatmap question, pinpointed, location-based feedback like this can be so difficult to collect.
How to Get Started With Heatmaps
Available for some paid accounts, the Heatmap question can be added in the build stage of any survey. Here’s how.
1. Click the Question link on the survey page where you would like to add the Image Heatmap question.
2. Select Image Heatmap from the Question Type dropdown and enter your overall question text.
3. Click on the image placeholder to add your image using the image library or by uploading your image directly to the question.
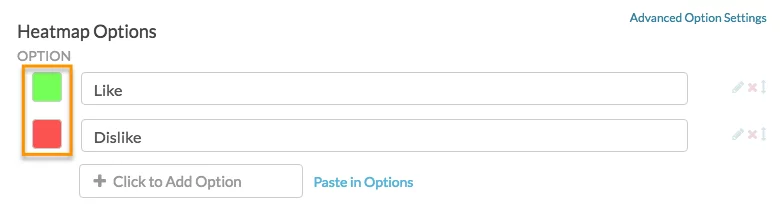
4. Customize your Heatmap Options (the Like/Dislike options) and colors. Choose colors by clicking on the color selector (highlighted below). This will be the color of the click marker visible to your respondents after they have selected an option to categorize their click.
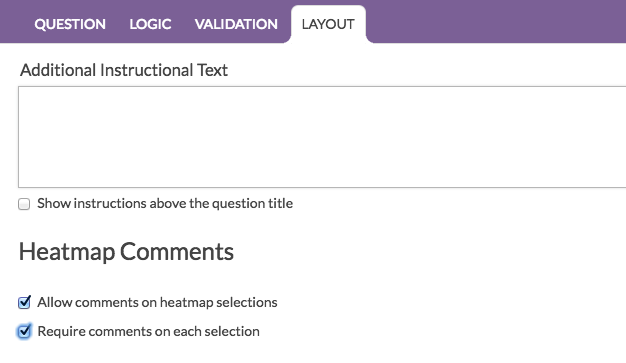
5. To customize whether or not you want a text box for additional comments, go to the Layout tab. Comments are enabled by default.
6. Customize messaging on the question, including instructions, and adding or removing options.
And you’re ready to go!
Keep in mind that this question type is highly dynamic, so it is currently available for online surveys only; it will not be available for offline surveys.
For more information, see our Help Documentation.
Getting Warmer with Heatmaps
This question type is often a favorite among respondents for being interactive and interesting, and you’ll love it to as you start collecting better data and direct feedback that you can really use.
If you don’t already have a paid account, click here find out more about this and the other advanced question types and features that will help you collect better data.