
Almost everything in our digital world was questioned, if not flipped upside down, this past year. What hasn’t changed is the conversation around mobile app marketing metrics. By and large, the typical mobile app marketing reporting dashboard looks the same as it did eight years ago: Revenue is king, downloads are queen, and app store optimization is a one-and-done game of keywords. But are these the metrics that really speak to mobile app marketing performance in 2021? Can a static dashboard do justice to a dynamic industry?
We say, it’s time for a change. Sure, the mobile app marketing metrics of old are far from broken, but that doesn’t mean they can’t be improved. An over-reliance on traditional metrics may cost mobile marketers missed opportunities and a sacrificed ROI, especially as mobile continues to solidify as a leading channel across all industries.
To better guide your mobile app marketing decision-making, we’ve identified six alternative mobile app marketing metrics that speak to the current state of the mobile app industry. Read on to build a reporting dashboard capable of measuring whatever the new year throws at you.
Out with the old, in with the new!
Six Mobile App Marketing Metrics Worth Adopting, and Six Worth Ditching
1. Uninstalls, Not Installs
Traditionally, installs (or downloads, or registrations) have stood out as the chief KPI of any mobile app marketing campaign. Yet, with everything we now know about an app’s retention, usage, and monetization, installs are no longer the be-all, end-all that they were in the early days of the App Store. Let’s say farewell to installs and welcome in a more powerful metric: uninstalls.
Where installs fall short

At its core, installs are an acquisition metric. The figure tells you how many people have discovered your app and proceeded to download and subsequently install it. It’s a pretty straightforward metric and provides some considerable (albeit assumptive) insights into competitive advantage and sustainability:
- If you have more installs than your competitor, you’re in good shape.
- If you see an upward trend in installs, your app is showing healthy growth.
The only problem? Installs aren’t big-picture. They fail to capture any data on the cost or the value of an install. With more information, the statements above can just as likely produce a negative result:
Your competitor has more active and loyal customers, even though your app has seen more installs. More customers are leaving your app than installing it, making overall customer growth negative even though install growth is positive. Alternatively, you’re paying more to acquire customers in the form of paid advertising than you’re collecting, thereby generating a negative return on your growing installs.

In other words, installs alone don’t provide enough information to make any meaningful analyses.
How uninstalls provide a better indication of an app’s health
A better metric for indicating an app’s overall sustainability is the antithesis of an install, the uninstall.
While installs are an acquisition metric, uninstalls are a retention metric. They tell you how many of your mobile customers discontinue using your app each week and whether this trend is growing or diminishing. Unlike acquisition metrics, which can be assumptive or downright faulty, retention metrics provide indisputable evidence into the long-term sustainability of your app.
To demonstrate the difference between using installs and uninstalls to assess an app’s health, consider the following scenario:
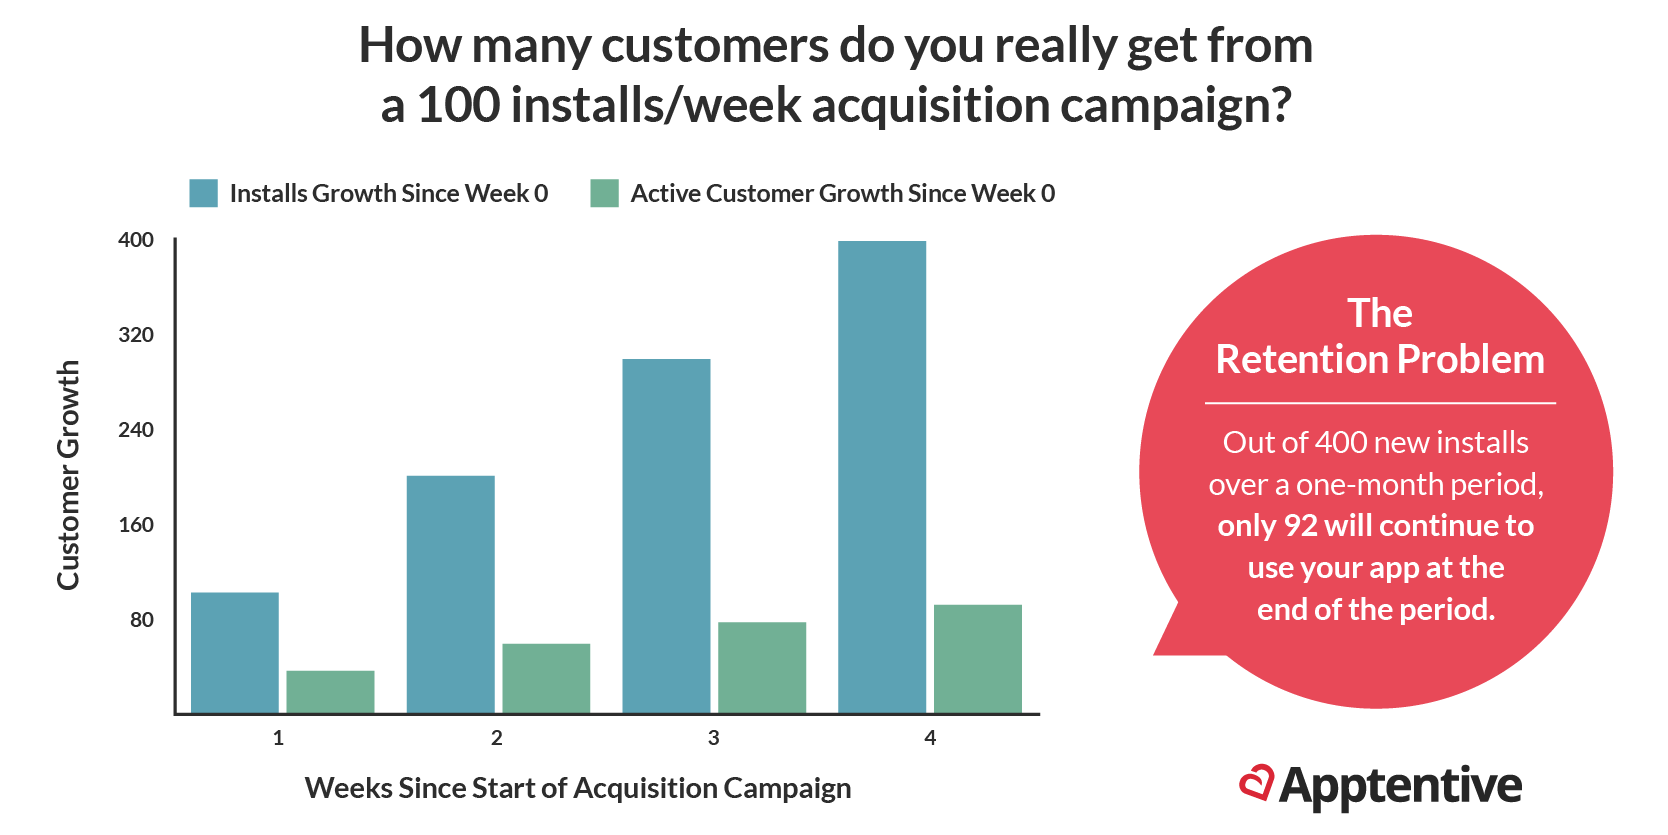
For example’s sake, assume you’ve orchestrated an acquisition campaign, either organic or paid, capable of bringing in 100 new customers a week for one month. From an acquisition perspective, this would be a strong campaign. You would measure a growth of 400 customers at the end of the month (100 installs/week x 4 weeks). Not too shabby.
From a retention perspective, the results look a little bleak. True, you have 400 new installs; but few of those new players will continue to use your app 24 hours after the install, let alone at the end of the four-week period. Instead of the promising 400 new customers measured above, you’d measure 92 new customers by month’s end to account for the dwindling retention rate. The math here is a little more complicated, but it essentially discounts for customer churn at the end of each week:
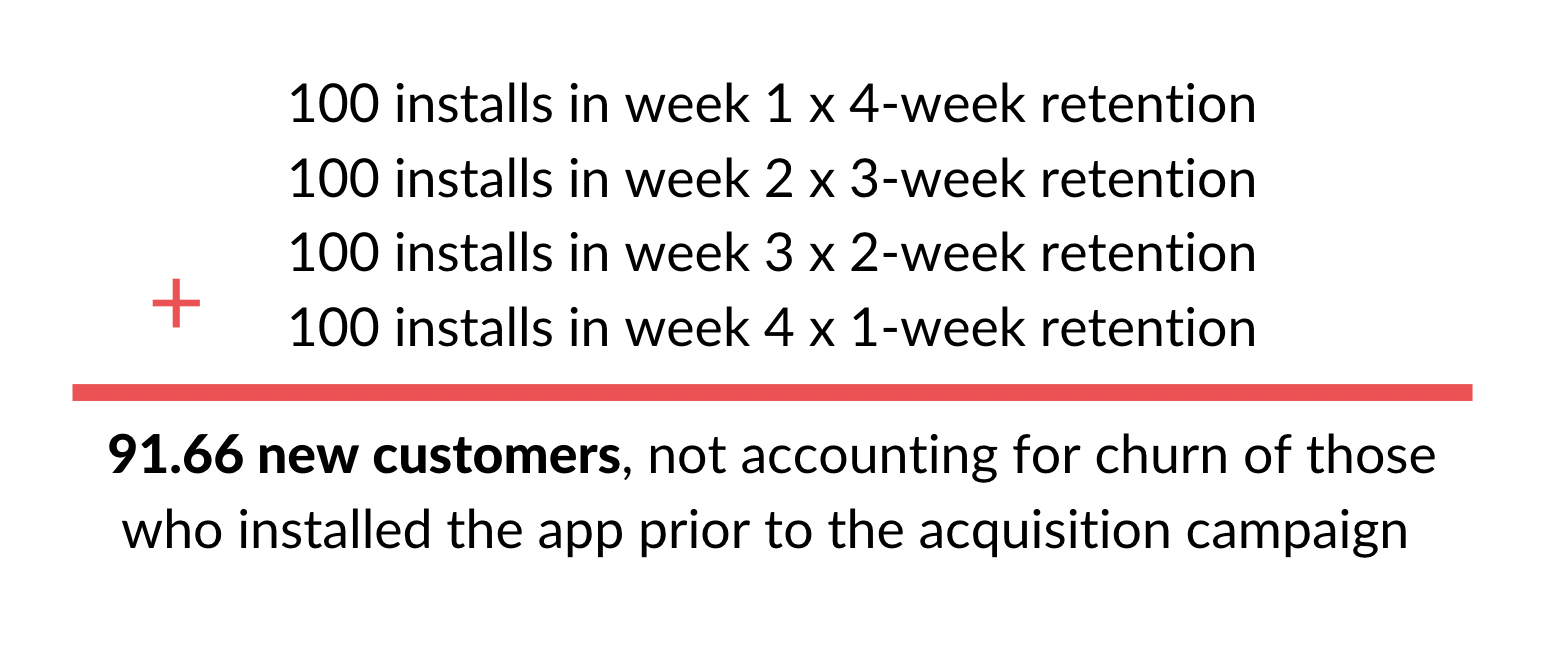
The result looks like this:
If your acquisition campaign was a paid one, this new uninstall-based ROI measurement carries an even stronger burden: As only one in four customers will continue to use your game at the end of the month, your cost per install is essentially 4x greater if you only intend to measure loyal or profitable installs. Down the line, we’ll see how this factors into our measurement of your return on investment.
With each of our proposed mobile app marketing metrics, it’s important to recognize that app marketing metrics are most effective when used in combination with other metrics. Used alone, uninstalls can’t provide all of the information we need to address the assumptions in install measurement. Namely, they can’t speak to the return on investment of a paid acquisition campaign. However, when used in tandem with other metrics like ROI or LTV, which we cover later, we can address such questions.
2. The Silent Majority, Not (Just) the Vocal Minority
Not a metric in and of itself, this next callout involves a range of metrics including the percentage of your mobile customers you’ve engaged/conversed with and the representativeness of your customer insights on your app’s greater audience. Simply, we recommend moving away from the lowest-hanging fruit of the customer insights world (your ratings and reviews, customer service contacts, social media mentions, etc.) and toward a comprehensive understanding of the voice of all customers.
Because many brands struggle to gather customer feedback in proactive, non-intrusive ways, feedback typically comes from the smallest, most vocal group of customers. Many brands today may think they build products around their customers based on feedback from a majority, but they couldn’t be further from the truth. In reality, our data shows that brands only hear from less than 1% of their customer base, which we call the “vocal minority.”
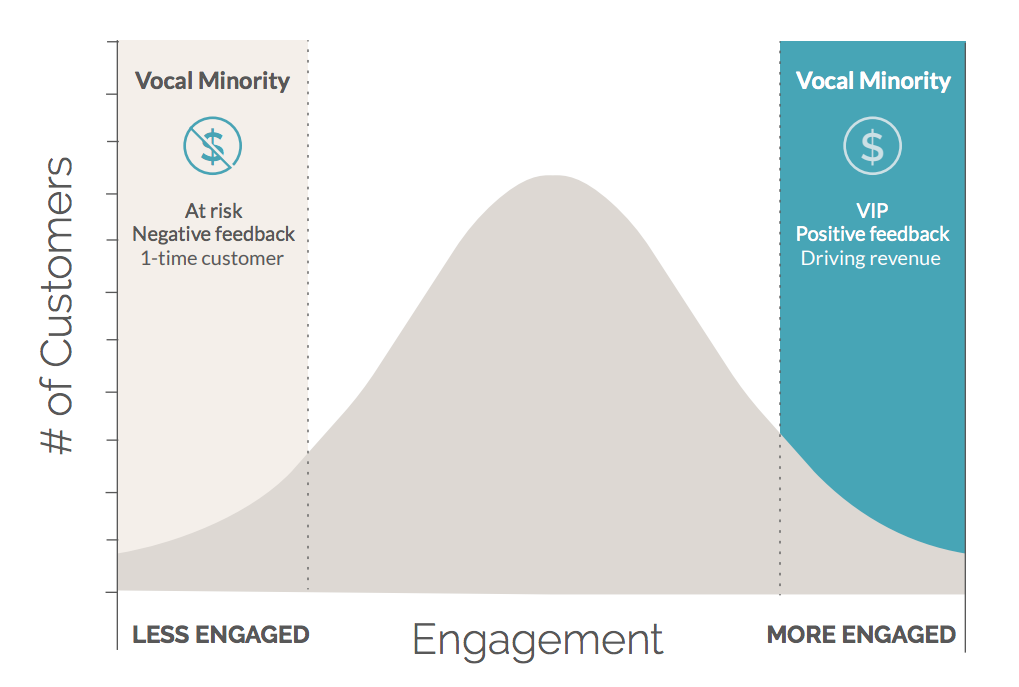
The vocal minority is made of up of two groups of customers: those who are at risk, and those who are VIPs. The at-risk customers have typically had a negative experience with your brand that triggered their feedback—their meal was bad, their flight was delayed, or they ran into an irritating bug in your app. They’ve raised their proverbial hands to alert you of their problem, whether it’s a one-off occurrence or affecting a larger group of your customers. The VIP group’s experience is just the opposite. These are your all-star, loyal customers—the ones who engage in every email, refer you to their friends, interact with you through other digital channels, and who purchase your goods and/or services regularly.
There is much to learn from the vocal minority of at-risk and VIP customers. The vocal minority has a lot to say, and product professionals and marketers must listen to the group’s feedback and respond to it (and act on it!) accordingly. But remember, the vocal minority makes up ~1% of the average brand’s customer base. The most dangerous decision a brand can make is acting on feedback that doesn’t accurately represent the majority of its customers.
To hear from more of your customer base and collect meaningful decision-driving information, what’s a brand to do? You must shift your priorities and the way you ask for feedback to unlock the “silent majority” of your customers.
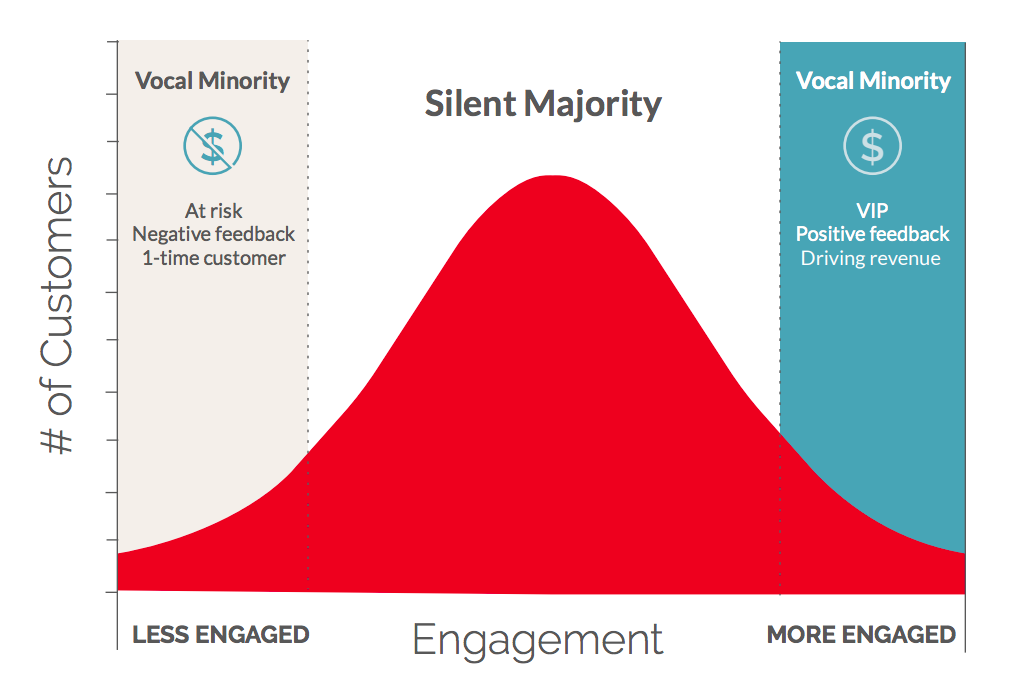
The silent majority is made up of roughly 99% of your customers who don’t fall into the vocal minority. These customers span across a broad spectrum of sentiment, but they tend to fall somewhere in the middle of loving your brand and being at risk for churn. The vast majority of your customers fall into the silent majority, and typically, their feedback and loyalty aren’t being fostered or prioritized.
Your next step is crossing the hurdle of getting the silent majority to provide feedback. Fortunately, customers expect you to ask them for feedback directly. Our research shows 51% of consumers expect companies to ask for their feedback across all channels (email, phone, in-store, online, in-app), and that number is even higher for consumers who prefer to leave in-app feedback (64%). What’s even better is that app customers are very willing to give feedback: 98% of our respondents said they will likely give feedback when asked. The key is to be proactive in asking for their feedback rather than waiting for them to raise their hands, and to ask at the right moment within your digital experience in order to give conversations the best opportunity to begin.
3. Return on Ad Spend, Not Cost Per Install
Cost Per Install (CPI) is widely regarded as the dominant factor in cost-benefit analyses of paid advertising campaigns. It’s a metric that spreads your advertising cost over all installs generated by those ads. It’s also a metric that fails to take into account the increasingly complex nature of mobile app marketing.
Just one piece of the puzzle
When mobile apps first caught on, the Cost Per Install metric was a favorite of marketers everywhere for its familiarity. The metric relied on the same intuition that guided digital marketing for years: minimize cost (in digital, PPC, or CPM) and maximize results (clicks and impressions).
Yet, as we’ve seen above, mobile app marketing is more complicated than this simple rule of thumb suggests (as is modern digital marketing, shown in its movement toward attributional metrics). The rule of thumb works well when there’s a small number of ad networks to choose from and a consistent, definable value that you can place on each result, or ad-generated install.
In mobile, we don’t just have Google and Bing to navigate. Today, there are hundreds of advertisement display networks, ranging from programmatic to geolocal, affiliate, and everything in between. Each network specializes in different customer segments and has a slightly different variation and CPI metric. Knowing the cost of working with any one network is a start, but tells you nothing about the opportunity cost of not working with any of the networks that could offer superior results.
Similarly, simply calculating your average revenue per user is no longer enough to guide your CPI investment. Not only is mobile ad blocking beginning to pose a serious threat to the advertising industry, but few ads are generating the sort of loyal customers that marketers anticipate when factoring in the hefty cost of paid acquisition. As above, few of your newly acquired customers will continue to use your app after the first week—meaning that much of your advertisement expenses are going toward unprofitable ads.
In other words, knowing your customer acquisition costs is necessary but not sufficient in guiding your investment decision.
The confidence of a calculable return
In the rapidly evolving mobile ad landscape, marketers require a more robust metric to guide their ad dollars. They require a metric that tells not just the absolute cost, but the relative cost as well. They require the warranty that they’re not just making a good decision, but the best decision—one that maximizes profits while minimizing costs (both in absolute and opportunity terms). In other words, they require a quantifiable and predictive return for their ad spend investment.
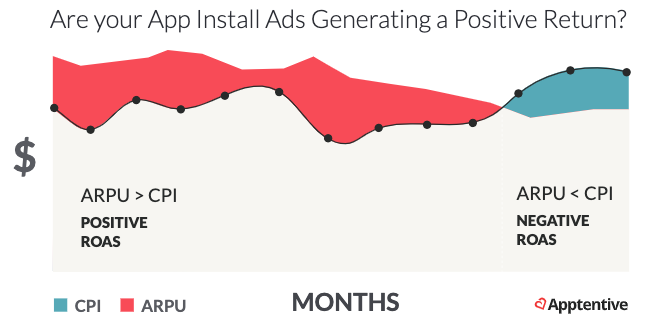
Whereas CPI falls short when it comes to relative costs, Return on Ad Spend (ROAS) does the job well by measuring your ad spend directly against the results it produces. While the results you’re interested may be in terms other than monetary, ROAS typically takes the form of:

If you’re measuring your anticipated return in dollars, you’ll be left with a single value for ROAS. This value allows you to allocate your marketing budget with confidence, with two simple, yet effective guidelines:
- Continue investing in ads, if ROAS is positive (that is, ad revenue > ad spend)
- Allocate your budget elsewhere, if ROAS is negative (that is, ad spend > ad revenue)
While this math may seem elementary, app publishers continue to throw money away on campaigns that cost more than they’re worth. We see this most commonly in the mobile game category, where the average ROAS sits around -$1, meaning every player introduced to the game by an ad costs the publisher a dollar.
In addition to directing your ad dollars, ROAS makes comparing the anticipated returns of different ad networks possible. This single monetary value can be directly compared across campaigns and across ad networks to show where your dollars can be spent most effectively. Instead of comparing an array of incompatible acronyms (CPI, CPLU, CPM, CPC, CPA), ROAS leaves you with just one number that remains meaningful and relevant regardless of the eccentricities of the campaign.
4. Criticism, Not Adoration
Less of a question of metrics and more of a shift in priorities, this next tip deals with the mentality that so many of us have around one-star and five-star reviews. We all love five-star reviews. They serve as self-validation, social proof, and a reminder of the loyal audience you’ve fostered. When a one-star review comes around, things are different. We feel disheartened and don’t give the review the time of day. We’re left refreshing our screens, just waiting for a new five-star review to push down that stain on our app’s reputation.
Yet, in 2020, this mentality has never been more dangerous to the process of continuous innovation an app needs to stay relevant in the eyes of its customers.
Falling victim to confirmation bias
There’s a reason five-star reviews fill us with a warm and fuzzy feeling. They tell us exactly what we want to hear.
For app publishers, however, there’s a big difference between hearing what we want to hear and hearing what we need to hear. Five-star reviews indicate that our app is right on track. Perfect as is. No changes needed.
Yet, the app stores are no place for stagnation. Even the top 100 apps average one update per month to maintain their prominent ranks and new market entrants are constantly embracing mobile and vying for share of a saturated market.
Five-star reviews trick us into thinking that there’s no more to be done; but just as soon as we come to believe this, a competing app is bound to show that there is more to be done in the ultra-competitive world of the app stores.
A new respect for one-star reviews
As our own Robi Ganguly told Forbes, “Negative reviews are the holy grail of customer feedback.”
A negative review means more than a single dissatisfied customer. What so many app publishers don’t realize is that negative feedback, of any sort, is incredibly rare—and not because their apps are just that great. The reality is that the average company only hears from one out of every 27 unhappy customers. That means that for every one negative review, 26 other customers will simply stop using your app without providing any indication why. So while no one likes to read criticism, that one review may just be the gift you need to improve your app and improve the experience for not only that one customer, but everyone who shares their thoughts in silence.
In addition to providing invaluable suggestions and feedback to guide your product roadmap and next app update, one-star reviews provide you with an opportunity to engage customers one-on-one and win them back. According to a Lee Resources survey found that 70% will do business with you again if you resolve their complaint.
So next time you see a one-star review, we urge you to think of it not as a stain on your app’s reputation, but as a gift—a gift of improved retention, revenue, and product quality. That is, if you know what to do with it.
5. Message Quality, Not Quantity
Often, app marketing is measured in actions: In push notifications sent, customers messaged, or rating prompts shown. As a result, we’re surrounded by brand communication, to the point where we’re exposed to 5,000 ads each and every day. But as marketers ramp up their communication, they’re greeted with marginally worse results (fewer clickthroughs, more app exits, etc.). They enter into a vicious cycle of increasing their messaging volume to make up for the poor results, all the while the customer is inundated with an app that now looks like Times Square. In 2021, app publishers will recognize the need to move away from such volume-based mobile app marketing metrics, and focus instead on the quality of their messaging.
Augmenting the customer experience with contextualized messaging
There’s a reason push notifications and other forms of brand communication are becoming increasingly less effective. Customers are bombarded.
In order to deliver the intended results, your communication must break through the clutter. It must be relevant, respectful, and most importantly, valuable in the eyes of the recipient.
Delivering value-packed messages is less a matter of which vehicle you use for communication and more about how you use it. Whether it’s a push, an in-app message, or an email campaign, approach it through the lens of the customer: How will this add value to their experience?
At Alchemer Mobile (formerly Apptentive), we’ve pioneered a framework and set of related tools for a better way to communicate with your mobile customers communication—one that breaks through the clutter and adds value. This comes down to two things:
- Personalization: Is the message relevant to the recipient? Is it unique to their individual wants and needs? Does it enhance their relationship with your app?
- Contextualization: Will your message make sense at the time and place it is delivered? Is it tied to the customer’s journey with your app?
In 2021, push and other forms of communication will become less of a general announcement and more of a personal conversation. And the publishers that move in this direction will find that messaging can, once again, be used to drive retention and engagement.
6. Customer Lifetime Value, Not Average Revenue Per User
Our final metric re-evaluation is one we’ve touched on in several of the propositions above. Just as installs fail to capture the retention piece and just as CPI data fails to account for relative costs, the Average Revenue Per User (ARPU) metric that so many app marketing dashboards highlight is a misguided and overly simplified figure. In 2021, we expect to see publishers getting more granular with their revenue estimations and attributions and being able to operationalize non-monetary elements of customer loyalty to better guide their financial projections.
Not all customers were created equal
Just as its name implies, ARPU spreads your entire app revenue (from ads, downloads, in-app transactions, or whatever your unique business model may consist of) over your entire active customer base:
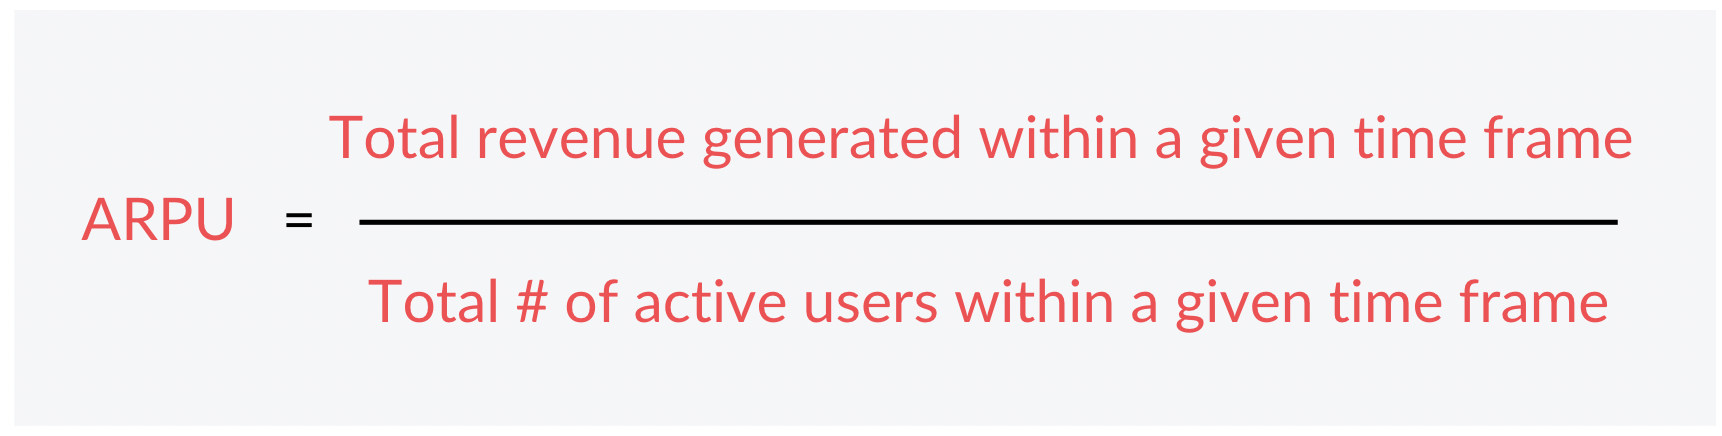
The metric is commonly used to guide financial projections, revealing insights into:
- How many active customers your app needs to make a profit
- How much an active customer is worth
- How much you can spend to acquire a customer
But, while ARPU does a decent job at addressing the above questions, its insights are limited. It’s subject to however you define ‘active’ and the fact that some of your revenue, particularly in the form of ad impressions, will likely have been generated by customers who fall outside of this bucket.
The metric further relies on the assumptions that all active customers generate the same amount of revenue and that all active customers will continue to use your app for the timeframe you’ve chosen for the calculation, typically one month. In reality, only about 20 percent of your customers make up the majority of your profits, and fewer than 40% of customers will use your app for a period lasting longer than 30 days.
In other words, publishers relying on ARPU risk misallocating their revenues and forming projections on the assumption that all active customers will generate the same amount of revenue as a customer who uses your app for an entire month.
Seeing customers as more than dollar signs
By no means is ARPU a bad metric. It is, however, an overly simplified metric; and when you’re dealing with something as precise as financial planning, simple can be dangerous. For reliable projections, you need a more all-encompassing mobile app marketing metric: Customer Lifetime Value (LTV).
LTV overcomes many of the limitations of ARPU by incorporating everything you know about your customers to calculate a more precise metric of value. Whereas ARPU is plagued by an assumption of a common (one-month) use period, LTV builds retention right into the calculation to determine the true length of a customer relationship. The resulting formula typically takes the form of:

From this formula, we can see that LTV has three components:
- Monetization, or ARPU: The dollar amount that a customer contributes to your bottom line over a given timeframe
- Retention, or 1/Churn: The level of engagement and loyalty customers exhibit for your app, expressed in the length of the average use period
- Virality, or referral value: The sum value of additional installs that a customer will send your way
By adding the elements of retention and virality to the more traditional ARPU metric, LTV provides a more holistic view of the worth of a customer relationship. It shows the power of retention marketing and the benefit of making an app that customers not only love but love to share.
Additionally, the LTV metric allows for meaningful segmentation or even reporting on the level of the individual customer. With the right analytics and customer insights, app publishers can get as granular as they like when it comes to deciphering customer value, exploring questions including:
- What levers do I have for increasing revenue?
- Is it more profitable to go after the monetization, retention, or virality angle?
- Are customers who discovered my app organically more valuable than those acquired by paid means?
- What role do referrals play in my app’s success?
- How much does a lost customer cost?
Like most of the mobile app marketing metrics we’ve proposed for app publishers in 2021, LTV isn’t a radically different concept from ARPU. It still provides roughly the same information and can be similarly used to guide your decisions and ad dollars. It is, however, an improvement upon ARPU. It fills in the information gaps that ARPU skims over with assumptions, and it recognizes the importance of less quantifiable elements, such as retention and referrals.
Wrapping it up
If you managed to make it this far, you’re well on your way to mobile app marketing metrics success.
If not (and let’s be real, this post is pretty dense), here is a summary of the highlights with six quick tips:
- Measure uninstalls instead of installs to better gauge customer growth and trends in retention.
- Give a voice to the silent majority to understand the wants and needs of your app’s customers and cater your product accordingly.
- Track ROAS instead of CPI to compare acquisition campaigns apples-to-apples and recognize the relative costs of advertising.
- Recognize the value inherent in one-star reviews in fueling continuous improvement and avoid equating five-star reviews with a perfect product.
- Focus on the quality, not the quantity, of your messages by personalizing and contextualizing your brand communication.
- Add precision to your financial projections by ditching ARPU for LTV, a metric capable of monetizing non-monetary contributions and robust enough to be calculated individually or on a cohort basis.
The app industry is rapidly evolving and increasingly complex. 2020 dramatically redefined what it means to compete in the app business, and 2021 is likely to pose just as many obstacles and opportunities to the world of apps.
These six mobile app marketing metrics are designed to ensure that you’re ready for both the obstacles and opportunities of 2021. Mastering these metrics will set you up for success with the precision and accuracy to guide your mobile app strategy in today’s app ecosystem.
As always, we’re here every step of the way with a library full of resources and a suite of mobile customer feedback solutions designed for data-driven marketing.
Wishing you all the best in your metrics measurement!