
When creating a survey, it’s typical to focus on writing questions, adding vibrant colors, and pouring over the beautiful results charts that you get from the results.
But between creating an engaging survey and gleaning valuable insights from its data comes the launch, a survey phase that is often neglected but very important.
We see five typical mistakes in the pre-launch survey phase that you should carefully avoid, and this guide will show you how.
Mistake #1: Not Inviting Others to Test the Survey
Let’s face it, no one is perfect. Surveys are like conversations. You get one chance to make a first impression.
You may have painstakingly set up logic, piping, actions, and other features to make your survey interactive and responsive, but if your survey is riddled with typos, grammar errors, or vague language then you just dramatically increased the likelihood of your respondents not finishing your survey.
It’s very easy to overlook something, and testing by yourself is fraught with the chance that a critical combination will be missed.
To avoid this issue, send your surveys to colleagues and team members for them to take. Allow your testers to make notes about things they find as problematic and use this data to return to your survey with fresh eyes.
By inviting others to test and thoroughly try your survey out, you dramatically increase the chance that any set up mistakes will be found and can be corrected prior to launch.
Some tips about testing:
- Invite many colleagues. Encourage them to take the survey 3 or 4 times. Ask for feedback as if they were a respondent. Encourage them to try different combinations in the survey.
- Check out the documentation on question types that you are using. For instance, Alchemer’s help documentation gives examples of how various question types report, look, and other caveats you should be aware of up front. You might even be surprised at some of the options available that you were not aware.
- If time permits, repeat the test. Ask your testers to try out the new and improved survey before launch. Better yet, make the time!
Mistake #2: Not Considering Reporting Values
Many people don’t consider the reporting values of their chosen question types and how they can help with data analysis, but you need to set up these values before you distribute your survey.
Also, if you know that your team will be analyzing the data outside of your survey software, such as with SPSS or Excel, you certainly want to be aware of this and structure your reporting values appropriately.
First let me go over a little terminology. Each survey question has answer options. For example, in a Likert scale question you might have these answer options: “Very Dissatisfied”, “Dissatisfied”, “Neutral”, “Satisfied”, and “Very Satisfied.”
Reporting values are the values that are assigned to the answer options so results can be displayed as clearly as possible. Your respondents will not see reporting values. If you use numbers for instance, you can generate statistics based on non-number answers.
A good way to illustrate what reporting values can do is to think of that Likert scale question with the five answer options I mentioned before.
If you choose not to use reporting values, then statistics will not be generated in the summary report other than the percentage of respondents that marked a particular answer option.
If you had reporting values and designated a 1 for “Very Dissatisfied” and 5 for “Very Satisfied”, with 2,3,and 4 being assigned to the graduations in between, now you can get statistics about your respondent’s choices, for instance an average score.
Another use for reporting values would be the following scenario. Let’s say you were asking an income question. You had 4 options in your survey:
- Under $20,000
- $20,001 to $40,000
- $40,001 to $60,000
- $60,000 and up
Even though the respondent has a choice, you know that for your needs you only need to distinguish what percent of respondents have an income of $60,000 or less. You could give the first three answer options the same reporting value, since they all have the same weight as far as your report data is concerned.
Logic may not work properly on questions where you adjust reporting values, so be sure to test thoroughly if this is something you choose to use.
Mistake #3: Not Considering How You Might Want to Report on Your Data
Sometimes we build a survey and use all sorts of fun question types and really mix things up. I know I personally love seeing a survey that has something other than radio button grid after radio button grid.
But creative question types can get in your way later if you haven’t considered your goals for the data you’re collecting.
Most people have an idea of what they would like the summary of their data to look like. You want to avoid a scenario where you gather responses, run a report, then are totally shocked by the reporting.
Every survey question reports a certain way. For instance, a radio button grid question reports as a table (shown below):

You also have the ability to add elements to the report and break each row of the table generated from the radio button grid out as a pie or bar chart if needed.
In contrast, a slider style question reports as an area chart (shown below) If you were not expecting that, you might be disappointed after you gather your responses.
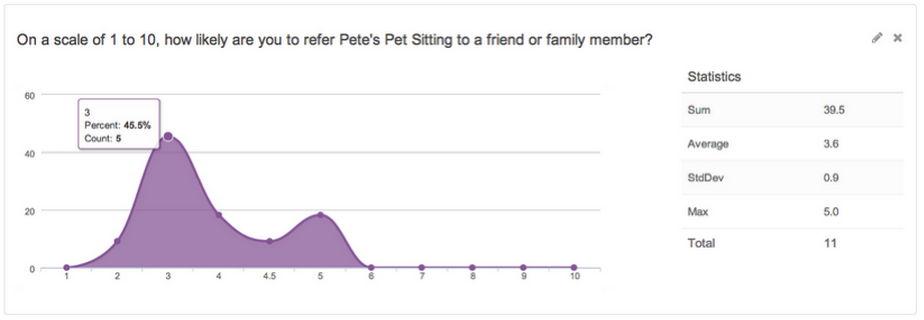
What I recommend is that anytime you are using a new question type, whether it be a slider or a drag and drop ranking, is to run a report with test data so there are no surprises.
This is another benefit of testing your survey in advance: you can run reports off of your test data and check out how it will report before you get actual respondents.
Mistake #4: Asking Open Response Questions if You Don’t Want to Read Them
I’ve had this very question asked to me before. “I collected over 1,000 responses, and I had two essay questions in the survey. Is there an easy or automated way to categorize them all?”
Well depending on how you feel about reading 1,000 responses, it may be easy or not. Alchemer does have an Open Text analysis tool where you can go through and manually categorize responses. You can then include graphs of your manually categorized responses in your summary report.
However, notice the use of the word “manual.” You (or someone) is going to have to go read all of the responses and do something with them. Where is that new intern again?
If you really don’t want to do this, then don’t ask open text questions.
If you are crunched for time or don’t have a spare intern lying around to read and bucket all of your responses, then look for ways to gather the data you need with closed questions.
If you are interested in reading the responses from your respondents, then by all means use open text questions. These questions can provide valuable qualitative data about the respondent. Make sure you are prepared to read them, and know there are not shortcuts. Otherwise you are simply wasting your and your respondent’s time.
Depending on the survey style and methodology, sometimes open text questions are pretty much expected. For instance, running an NPS survey without asking a follow-up question about their ranking is a faux pas. Thankfully, in cases like this you could just use an email action to email the responses to stakeholders as they come in.
Mistake #5: Not Taking Advantage of Validation
Imagine this survey question: “Which retail location did you visit?”
Now imagine this is an open text question, and there are four possible locations. Let’s say there are locations in Boulder, Denver, Colorado Springs, and Cheyenne.
Here are the possible answers you could get for Boulder alone:
- Boulder
- boulder
- Boulder, Co
- Boulder, CO
- Bouldr
- Boulder Colorado
- boulder colorado
See where I’m going? How are you ever going to make sense of so many different answers?
By using validation.
For instance, you can force capitalization in the answer. You can validate only certain numerical ranges. You can specify a minimum and/or a maximum number of checkboxes selected. You can use regular expressions to customize validation for your needs. And this list only scratches the surface of what is possible.
In the example that I gave above you can use auto-complete so that the correct city would appear in the textbox as the respondent started typing.
You can even force the answers to be one that you have pre-specified, spelled and capitalized correctly.
Trust me, if you are considering using an open-text field, you will want to leverage validation so that your data is easily usable. Also, you should always consider when another question type might be best. In my scenario, a radio button question would simplify the process immensely.
Avoid These Mistakes, Lower Your Survey Stress Levels
You can avoid a lot of grief if you take some time up front and look at surveys as a process that has a distinct cycle. From creating and testing to distributing and reporting, great survey design is worth every minute you spend on it.
Ready to take the next step?
We have a series of on demand webinars about Great Survey Design that can help you formulate a framework under which to test, create, distribute, and report on your surveys.