Last month, we released the 2019 edition of our Mobile Customer Engagement Benchmark Report. The report is meant to serve as a yardstick for companies seeking to understand how their customer feedback metrics stack up against the market, and includes mobile benchmarks aggregated across all verticals.
Now, we’re excited to slice the data further and present a industry-specific guide of 2019 mobile app benchmarks. Data included is from both Android and iOS apps in the Food and Drink, Travel, Finance, Shopping (Retail), Media, and Lifestyle categories.
Although all apps are published to the same app stores, customer expectations and use cases vary tremendously between app categories. It’s important to remember that all apps aren’t expected to be created equal, and app publishers shouldn’t all take the same approach to engagement and user experience.
The data included in this report looks at how engagement metrics impact an app’s discoverability, loyalty, and retention rates by drilling down into specific app store categories. In the first half of the report, we look at how apps in each category stack up to the others.
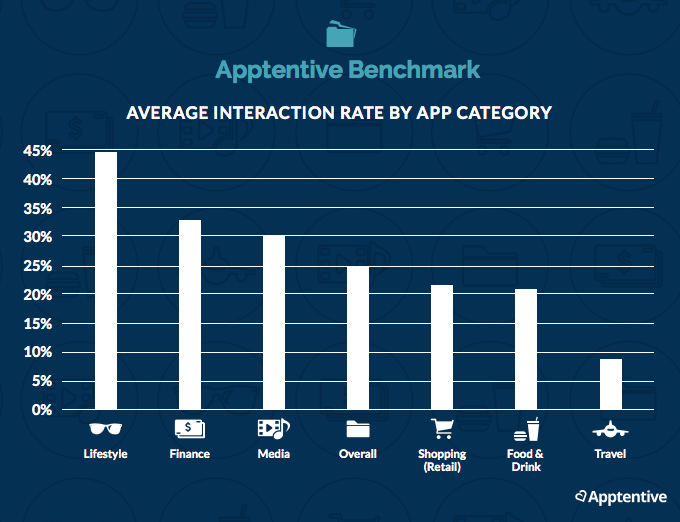
For example, interaction rate looks at the percentage of customers companies reached out to in app. As you can see in the data below, interaction rates vary widely across app categories, with Lifestyle being the most interactive (44%) and Travel being the least (14%). The reason for this range centers primarily on how customers use apps differently in each category, and how brands leverage their apps as customer engagement tools to interact with them.
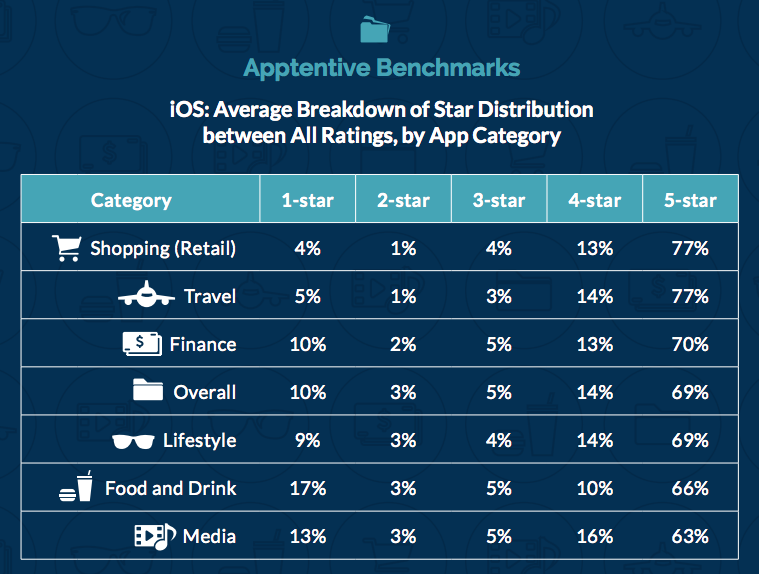
Additionally, looking at the below data on star distribution across app categories, we’re reminded of one of the foundations Alchemer Mobile (formerly Apptentive) was founded on years ago: Consumers use the app stores to give feedback on content rather than the app itself. For example, consumers of Media apps tend to leave comments around topics of news coverage or shifting political climates more than they do about the experience with app they’re using. That said, star ratings and reviews absolutely still matter to app health, but when it comes to understanding customer sentiment, they are one small piece of a very large puzzle all apps must figure out in order to stand out.
The second half of the report goes deep into data focused on individual app categories, along with tips on how app publishers can improve based on their industry. We also created a scorecard view for apps in each of our featured categories. These scorecards show what an average app’s customer engagement and feedback metrics look like to make it even easier for you to analyze your current strategy, along with industry-specific tips for success. Below is a snapshot from the Media app category scorecard.
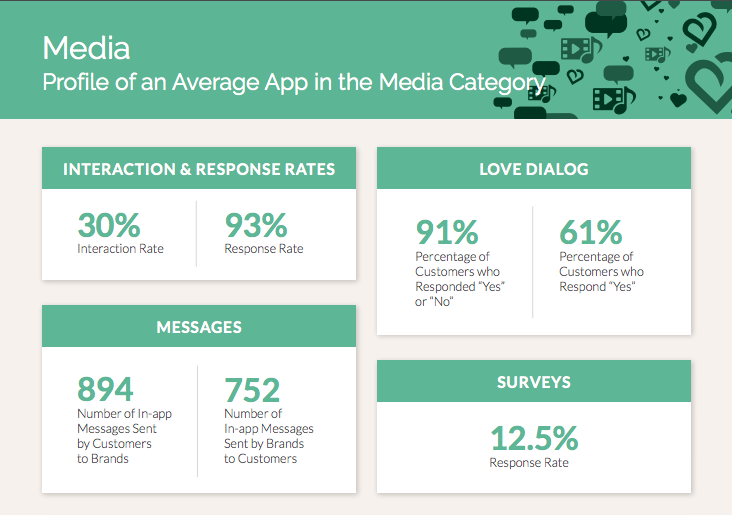
Download your copy now
Customers are hard-pressed to leave feedback in any form, and the way digital customer feedback is gathered is often clunky, time-consuming, and distracting from the goal the customer came to accomplish in the first place. Companies across all industries must drive urgency and base their business decisions on the most important entity driving revenue: the customer.

From our findings, we hope you’re able to take our benchmarked view of the mobile app landscape to understand how your own app is performing, and uncover opportunities for improvement. Download a copy of the guide now to get started!