- Resource Library
- E-guides
- Make a Change: Turn CX Insights Into Real Improvements
Guide 4: Make a Change — Turn CX Insights Into Real Improvements
A 10-step checklist, real-world use cases, and practical ways to use dashboards, alerts, and AI

Intro
You’ve done the hard part. You’ve asked the right questions, explored the data, and uncovered what’s really happening in your customer experience. Now comes the part where most CX efforts stall—making the change real across teams, systems, and day-to-day work.
This guide is your bridge from insight to impact. You’ll get a 10-step checklist you can use to plan, prioritize, and roll out CX improvements without losing momentum to competing priorities or unclear ownership.
You’ll also see what “making a change” looks like in practice through three customer stories (Pat improving CSAT, Tom reducing churn, and David strengthening support satisfaction) each showing how teams used dashboards to create alignment, set goals, define scope and timelines, and bring stakeholders along for the ride.
A 10-step Checklist for Making CX Change Stick
Customer experience change doesn’t fail because teams lack ideas. It fails because good intentions don’t survive real life: competing priorities, unclear owners, and “we’ll get to it later.” Use this checklist to move from insight to impact and keep momentum when the novelty wears off.
Start with the truth: assess the current state
- Pull customer feedback from multiple sources (surveys, interviews, reviews, social listening, support logs).
- Map the current customer journey and flag pain points, bright spots, and the “moments that matter.”
- Validate what you’re seeing with both quantitative (NPS, CSAT, churn, FCR) and qualitative input (open comments, interviews).
Output: A shared, evidence-backed view of what’s working, what’s broken, and what matters most.
Set the destination: define your CX vision and goals
- Define a compelling, organization-wide vision for the desired customer experience.
- Align CX outcomes to business outcomes (retention, revenue expansion, reduced cost-to-serve).
- Translate the vision into measurable targets (KPIs), such as improving CSAT by X, reducing time-to-resolution by Y, and increasing repeat purchases by Z.
Output: A “north star” + KPIs that tell you if change actually helped.
Focus your bets: prioritize and scope improvements
- Rank opportunities by impact and feasibility. Start with high-impact, low-complexity wins.
- Define the objective for each initiative (“Reduce cart abandonment by 15%,” not “Improve checkout”).
- Confirm you’re solving root causes, not symptoms (the “why” behind the friction).
Output: A realistic backlog of CX improvements with clear success definitions.
Build the engine: secure leadership buy-in and governance
- Lock in executive sponsors who will champion the work and unblock decisions.
- Create a cross-functional governance model (who decides, who executes, who’s accountable).
- Establish a cadence: monthly steering + regular working sessions to keep things moving.
Output: Decision-making that doesn’t stall in the “alignment” twilight zone.
Shape what “better” looks like: map the future customer journey
- Create or refine customer personas rooted in real data, not assumptions.
- Design the future-state journey with emphasis on high-impact touchpoints.
- Bring in cross-team input (support, marketing, product, ops) to prevent silo’d fixes that create new problems downstream.
Output: A future customer journey teams can build toward together.
Co-design solutions with the people closest to the customer
- Involve front-line employees early; they know where the process breaks under pressure.
- Run cross-functional workshops to brainstorm, pressure-test, and refine solutions.
- Prototype or pilot small changes to validate quickly and reduce risk.
Output: Solutions people will actually use because they helped shape them.
Make it real: action plans, ownership, and enablement
- Assign owners, roles, timelines, and dependencies for each initiative.
- Update workflows, policies, and documentation to reflect the current processes.
- Provide targeted training (empathy, problem-solving, customer-centric decision-making, new tools/processes).
- Recognize and reward behaviors that reinforce the new CX standard.
Output: A tangible plan and teams equipped to deliver.
Implement change in waves (and don’t forget the tech layer)
- Roll out in manageable phases or pilots before scaling organization-wide.
- Use technology to support consistency and personalization (customer data, automation, AI/chat, knowledge management).
- Ensure tools integrate cleanly with current processes, so employees aren’t forced into workarounds.
Output: Changes that scale without breaking teams (or customers).
Communicate like you mean it: engage throughout the change
- Clearly explain what insights have been uncovered, what changes are coming, and why they matter, for both employees and customers.
- Use multiple channels (email, meetings, training, FAQs) and repeat key messages.
- Create two-way feedback loops so concerns surface early and fixes happen fast.
- Share progress openly: wins, learnings, and what’s next.
Output: Buy-in that’s earned, not assumed.
Measure, monitor, and refine (because “done” isn’t a thing)
- Create custom Dashboards (link) to track outcomes against the KPIs you set (NPS, CSAT, churn, retention, resolution time, complaints).
- Set alerts and gather ongoing feedback from customers and employees to monitor early results, spot gaps fast, and make quick tweaks as needed.
- Share quick wins and customer stories to keep energy up and investment justified.
- Institutionalize what works: SOPs, performance expectations, onboarding, and continuous improvement rituals.
Output: A CX change that becomes “how we work,” not “that project we did last quarter.”
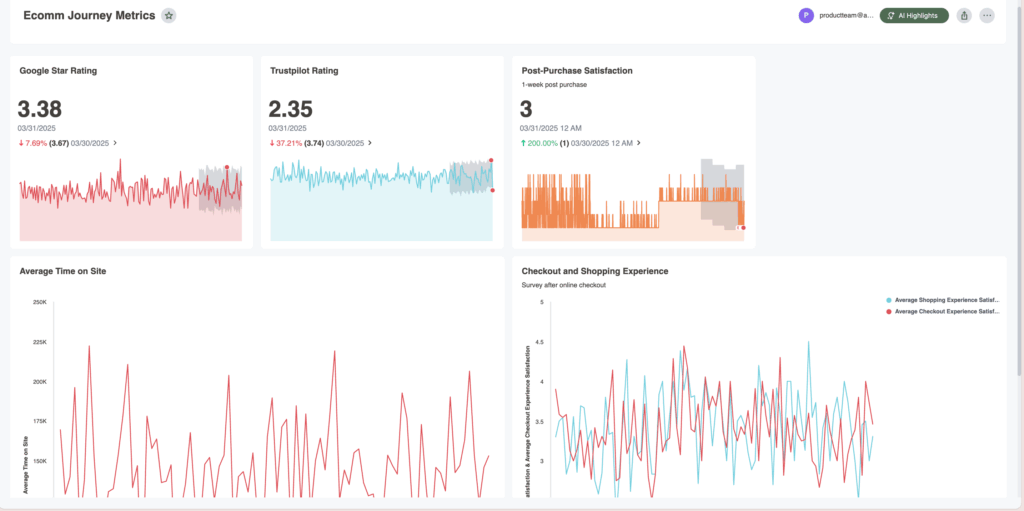
Alchemer Dashboard: Turn Feedback Into Results
Alchemer Dashboard delivers real-time, AI-powered insights that drive smarter decisions. Get a complete and actionable view of what’s working (and what’s not):
- A Complete View = Action: Easily build and customize your dashboards, connecting feedback with business data for a 360° view of what’s working—and what’s not—so you can act decisively.
- Turn Feedback into Business Impact: Transform feedback into dynamic, real-time insights that drive measurable outcomes. Don’t rely on static reports – instead, uncover actionable intelligence.
- AI-Powered Insights, Instantly: As easy as typing a question—and boom—gain deep analytical insight, without the hassle of complex BI tools. Powerful, AI-driven insights that empower everyone to explore data, uncover trends, and act right away.
Dashboard Use Cases - Continued
Now let’s look at change in action. In the stories we shared in “Question and Explore: Find the “Why” Behind Your CX Metrics“, each team started in the same place: a problem that wouldn’t budge and a pile of feedback that only hinted at what was really going on.
But the real magic didn’t come from spotting the insight, it came from actions taken. You’ll see how these organizations moved from “we think this is the issue” to clear priorities, practical fixes, measurable improvements, and the results that followed.
Improve customer satisfaction
Use Case 1: Improving Customer Satisfaction (CSAT)
Recap
When Pat, a marketing director at a global retail brand, sees CSAT drop for the first time in six months, she treats it like what it is: an early warning. She jumps into Alchemer Dashboard to pinpoint what changed, where it changed, and who it impacted. By slicing CSAT by channel, country, week, and age group, and layering in verbatim comments, she connects the dip to a website update in Canada that made key tasks harder (especially for older customers). With a clear root cause and a defined affected audience, Pat has what she needs to prioritize fixes, validate improvements, and stop the slide before it turns into churn.
For the full recap, read the companion piece “Question and Explore: Find the “Why” Behind Your CX Metrics“.
Changes Made
Armed with real insight (not guesses), Pat runs the playbook from the 10-step CX change checklist to turn a dashboard discovery into coordinated, measurable action:
- Assess and align on the current state: Pat shares the dashboard findings and customer comments with product, marketing, and retail teams so everyone rallies around the same story of what’s going wrong.
- Define the “better” experience: Together, they agree on what success looks like, fewer dead-ends on the site, faster task completion, and a smoother experience for every age group, especially 55+.
- Prioritize for impact: They sequence the work so the highest-impact fixes land first: navigation, account access, and search reliability in Canada.
- Bring the right people in early: Front-line retail staff and support agents weigh in on the top complaints they’re hearing, helping the team avoid fixes that don’t hold up in the real world.
- Pilot, prove, and scale: Pat and the product team roll out improvements in phases in Canada, using A/B testing to validate what actually improves satisfaction before expanding globally.
- Enable employees: In parallel, Pat partners with retail leaders to launch targeted in-store training in lower-performing regions.
- Communicate clearly: Pat keeps leadership and cross-functional teams updated with a simple narrative: what they learned, what’s changing, and how they’ll measure progress.
What changes did they implement?
- Redesign key website pages tied to the biggest pain points.
- Improve site search functionality and A/B test solutions to learn what works fastest.
- Launch in-store training programs in lower-performing regions to reduce friction and build confidence during the transition.
oUTCOMES
With Alchemer Dashboard, Pat didn’t just diagnose the problem, she laid out a path forward. The team could now:
- Prioritize with confidence using real-time insights instead of opinions.
- Track CSAT and NPS progress over time and how improving website functionality and training programs impacts these scores.
- Drill into customer sentiment by region, channel, age group, and team to spot issues early, before they show up as churn.
- Sustain the change by making dashboards part of the team’s operating rhythm, not a one-time report.
Because when you truly listen to customers, and act on what they tell you, customer satisfaction isn’t just a score. It’s a competitive advantage.
Improve Cutomer Retention
Use Case 2: Improving Customer Retention
Recap
Tom, the director of customer experience at a tech company, gets an alert that churn risks are climbing for the third straight month. Instead of chasing theories, he pulls together usage trends, NPS/CSAT, purchase frequency, support data, and churn signals into a customized retention dashboard. The pattern becomes hard to ignore: “Gold” members are churning at surprising rates, and the data points to a deeper issue, customers are losing confidence in product quality. What looked like a loyalty problem is really a value and trust problem.
For the full recap, read the companion piece “Question and Explore: Find the “Why” Behind Your CX Metrics“.
Changes Made
Tom doesn’t treat this like a quick campaign fix. He runs it as an organizational change initiative using the 10-step CX change checklist, so the solution sticks across teams, not just inside CX.
- Assess and align on the current state: Tom uses the Dashboard to quantify churn risk and connect it to product quality signals (support themes, feedback trends, low repeat usage).
- Set a clear vision and goals: He defines three success metrics, reduce churn in Gold by X%, improve product-related CSAT by Y points, and increase repeat usage within Z days.
- Secure leadership buy-in and governance: Tom brings the data to product leadership and secures an executive sponsor. They set a cross-functional operating rhythm (CX + Product + Support + Marketing) with clear owners and timelines.
- Prioritize and scope the work: The group narrows the focus to the highest-impact quality issues, agrees on what will (and won’t) be addressed first, and builds a phased plan.
- Co-design solutions: CX shares voice-of-the-customer examples alongside trends; Product maps fixes; Support contributes the most common failure points; Marketing refines messaging so customers understand what’s changing.
- Implement with pilots and clear communication: They roll out improvements in waves, communicate transparently to customer segments most at risk, and create internal awareness so teams tell a consistent story.
- Enable teams: Support gets updated troubleshooting guides and escalation paths; CX and Marketing align on retention playbooks; Product shares release notes in plain language.
- Monitor early and refine: Alerts and ongoing feedback loops help them spot whether churn risk is dropping so they can adjust fast.
What changes did they implement?
- Launch targeted outreach to Gold members with incentives and engagement campaigns
- Adjust pricing communication to minimize churn sensitivity
- Offer personalized onboarding for low-usage customers
- Improve support coverage in regions where CSAT was lagging
- Align product + CX around a quality improvement plan informed by real customer data
oUTCOMES
Instead of scrambling to respond to churn after it happened, Tom and his team built a proactive retention strategy. The dashboard didn’t just warn them it was happening, it helped them prove why it was happening, rally the right teams, and execute a plan customers could feel.
As they refined their approach over the next few quarters, churn rates dropped, NPS climbed, and Gold membership stabilized as product confidence rebounded. Retention moved from a guessing game to a repeatable system: detect risk early, fix the root cause, communicate clearly, and keep measuring until “better” becomes the baseline.
Spark: Your AI-Powered Dashboard Experience
Alchemer Dashboard’s AI features help you move past static charts to the insights that matter. Instead of hunting for patterns manually, AI surfaces trends, explains what changed, and identifies root causes—so teams of any skill level can get to answers faster.
Improve support satisfaction
Use Case 3: Improving Support Satisfaction
Recap
David, the Manager of Customer Support at healthcare company, is fighting a familiar support monster: tickets pouring in from chat, email, phone, and mobile, each with its own workflow and metrics. CSAT surveys go out after every interaction, but the insights live in silos, so patterns are easy to miss and hard to prove. David builds a centralized Support Performance Dashboard in Alchemer to pull post-interaction CSAT and NPS into one view.
Almost immediately, the story sharpens: chat support CSAT dropped 15% during the busiest stretch of Q1, and the dip aligns with one specific driver, promptness. When David segments by customer type, he finds another pressure point: new users are less satisfied, especially when their first support experience includes long wait times. Now he’s not guessing. He has a clear “what,” “why,” and “who” to guide the next move.
For the full recap, read the companion piece “Question and Explore: Find the “Why” Behind Your CX Metrics“.
Changes Made
David uses the 10-step CX change checklist to turn these insights into improvements that stick across channels, teams, and busy seasons:
- Assess and align on the current state: David shares the dashboard findings across support leadership and team leads to align on the core issues: chat response time during peak volume, and a weaker experience for new users.
- Set a clear support experience goal: The team defines what “better” means (faster chat response times, stronger first-contact experiences for new users, and consistent quality traits like courtesy and expertise). They tie it to measurable targets (response time, FCR, chat CSAT, and new-user CSAT).
- Prioritize high-impact fixes first: They focus on the two levers most linked to satisfaction: staffing coverage during peak periods and onboarding support pathways for new users.
- Co-design solutions with front-line agents: Agents help pinpoint where delays occur (handoffs, queue rules, escalation gaps) and what customers ask most in early-stage onboarding—so fixes address root causes, not just symptoms.
- Implement in manageable waves: David adjusts staffing and routing rules first, then refines onboarding support content and workflows; testing changes during high-volume windows before rolling out broadly.
- Enable teams with training and clarity: Team leads reinforce best practices for speed + quality, and agents get updated onboarding resources and escalation guidelines to support new users confidently.
- Communicate and keep feedback flowing: David sets up simple team updates and a feedback loop so agents can flag friction fast (and so improvements don’t stall in “we’ll revisit later”).
- Monitor early and refine: He sets alerts to catch satisfaction dips early, then uses trend reports to fine-tune staffing plans and coaching focus by channel and team.
What changes did they implement? - Address chat staffing and response-time gaps during peak volume
- Refine onboarding support to improve first-time experiences for new users
- Monitor team-specific trends in courtesy, expertise, and enthusiasm to keep quality consistent
- Set alerts so dips in CSAT and response time get attention fast, not weeks later
oUTCOMES
The result is a support operation that runs with more consistency. Response times improve, chat satisfaction rebounds, and new users get a stronger first impression. Just as important, David’s team gains clarity and control: they can see what’s happening in real time, understand why it’s happening, and make targeted adjustments before small issues become big customer problems.
Conclusion
Change doesn’t just happen because you found the insight. It happens because you turned that insight into a plan, got the right teams moving in the same direction, and followed through long enough for customers to feel the difference. That’s what this guide is really about: building a repeatable way to go from “something’s off” to “here’s what we fixed and here’s the proof.”
Now it’s time for the part that separates one-time improvements from lasting momentum. In “Step 5: Using Dashboard to Drive Change“, you’ll learn how to set up dashboards, overview pages, and alerts that track what’s working, catch issues early, and keep your CX gains growing over time, without turning measurement into a full-time job.
Interested in seeing how Dashboard can transform your feedback?
The Roadmap to a Great Dashboard!
This e-guide is just one part of a multi-guide series and story. Use the links below to checkout the other guides!
Step 1: Setting the Foundation for an Effective Dashboard
Step 2: Measure & Benchmark for Smarter Business Decisions
Step 3: Question and Explore: Find the “Why” Behind Your CX Metrics
Step 5: Using Dashboards to Drive Change
A practical guide to turning CX insights into action, with a clear 10-step framework and three real-world examples.