Guide 5: Using Dashboards to Drive Change
Intro
Launching a dashboard or making programmatic changes is a major milestone—but it’s not the finish line. The real value of feedback programs comes from what happens after changes are made.
Monitoring for improvement is how you close the feedback loop. It ensures your initiatives are actually working, helps you catch issues early, and keeps teams aligned around progress over time. Instead of reacting to one-off reports, you move into a rhythm of continuous insight, accountability, and action.
This step-by-step guide shows how to use dashboards, recurring reports, and alerts to turn monitoring into a sustainable habit—not a manual chore.
Step 1. Build Recurring Reports That Run Without You
Dashboards are great. But dashboards that require someone to remember to check them? Those eventually become decorative.
Instead, turn your key views into recurring reports that land in the right inbox (or channel) at the right time—automatically.
Do this:
- Identify the decisions that happen on a schedule (weekly CX review, monthly business review, quarterly planning).
- Match those meetings to a repeatable dashboard report that shows the metrics and trends needed to make the call.
- Keep the report focused. If it reads like a data dump, people will skim it and move on.
Common cadence patterns (use what fits your reality):
- Daily: operational spikes, high-volume transactional feedback, frontline issue detection
- Weekly: support performance, churn signals, segment movement, trend shifts
- Monthly: executive reporting, lifecycle health, initiative impact, progress vs. baseline
And one more thing: if the report has no clear audience, it has no chance. Reports should have names on them—owners, reviewers, and decision-makers.
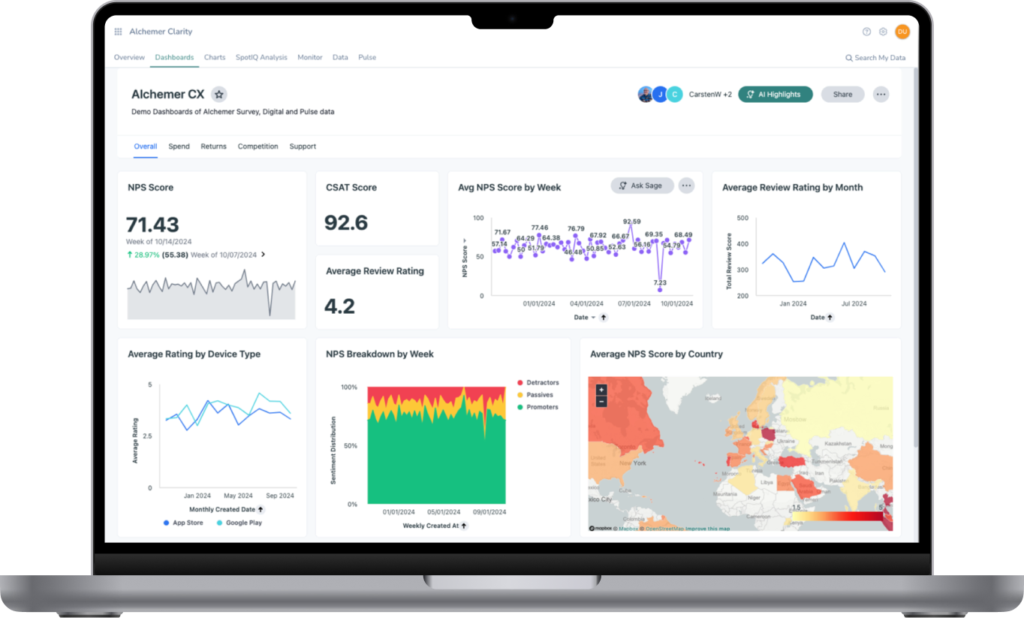
Alchemer Dashboard: Turn Feedback Into Results
Alchemer Dashboard delivers real-time, AI-powered insights that drive smarter decisions. Get a complete and actionable view of what’s working (and what’s not):
- A Complete View = Action: Easily build and customize your dashboards, connecting feedback with business data for a 360° view of what’s working—and what’s not—so you can act decisively.
- Turn Feedback into Business Impact: Transform feedback into dynamic, real-time insights that drive measurable outcomes. Don’t rely on static reports – instead, uncover actionable intelligence.
- AI-Powered Insights, Instantly: As easy as typing a question—and boom—gain deep analytical insight, without the hassle of complex BI tools. Powerful, AI-driven insights that empower everyone to explore data, uncover trends, and act right away.
Step 2: Schedule Regular Data Updates So Your Dashboard Stays Alive
A dashboard can be beautifully designed and still be wrong in the only way that matters: it’s outdated.
After making programmatic changes, organizations should ensure the data feeding the dashboard is refreshed continually. That usually means automating survey deployment and data refresh at consistent intervals—daily, weekly, monthly—based on how quickly the business needs to respond.
What to put in place:
- Automated survey deployment (transactional, lifecycle, in-product)
- Consistent refresh intervals (so your “current” view is actually current)
- Integration reliability checks (CRM, support tools, product usage, billing—wherever context lives)
What this protects you from:
- Making decisions on outdated or partial data
- Re-litigating whether numbers are “real” in every meeting
- Discovering issues weeks after customers already felt them
If your team ever says, “We’ll know how it went next quarter,” you already know the problem. That’s not monitoring. That’s archaeology.
Step 3: Track and Benchmark the Metrics That Prove Impact
Monitoring isn’t watching numbers move. Monitoring is watching numbers move against something meaningful.
Anchor your improvement tracking to baselines you trust, then benchmark forward.
Core VoC and CX metrics to track:
- NPS and/or CSAT (trend + segmented views)
- Churn and retention indicators
- Response rate and completion trends (engagement is part of the story)
- “Leading indicator” metrics you’ve defined (time to resolution, onboarding success, effort score, etc.)
What you’re looking for:
- Improvement vs. baseline (not just vs. last week)
- Segment-level movement (who’s improving and who’s getting left behind)
- Segment-level movement (who’s improving and who’s getting left behind)
A two-point lift in NPS might be meaningful. Or it might be noise. Benchmarking helps you tell the difference.
Step 4: Analyze Trends and Patterns—Not Just Point-In-Time Results
This is where a lot of teams get fooled. They react to a snapshot and miss the movie.
Single data points feel decisive, but they’re noisy—shaped by timing, outliers, and short-term effects. Acting on them alone often leads to overcorrecting or celebrating too early.
Trends tell you what’s really happening.
Looking at results over time helps you separate signal from noise and understand whether changes are durable or just blips. Trend analysis lets you:
Look at results to:
- Confirm whether a change is creating sustained improvement
- Catch slow declines that might not set off alarms yet, but are worth paying attention to before they grow
- Identify recurring patterns (seasonality, product release cycles, staffing turnover)
- Spot lagging impact (CSAT shifts first, retention follows later—often)
Use trend analysis to avoid:
- Overreacting to short-term noise
- Declaring success too early
- Missing compounding issues that build gradually
- Confusing correlation with real impact
Here’s a simple rule that keeps teams grounded: If you can’t show it over time, you can’t claim impact.
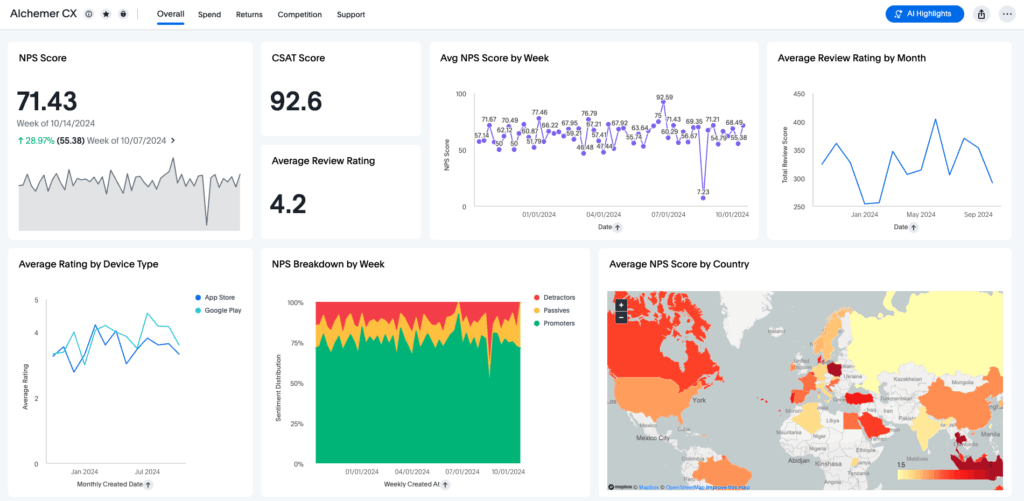
One View of Customer Feedback, Across Digital and Survey Data
It’s not easy to uncover when your feedback is scattered. App ratings live in one place, survey responses in another, and connecting the two takes time most teams don’t have. That’s changing.
Alchemer Digital data flows into Alchemer Dashboard natively, right alongside your survey data. Love Dialog, Rating Dialog, Surveys and Prompts sit next to your survey responses in the same live, interactive dashboards. So you can see the full picture: what customers tell you inside the app and what they tell you through your surveys, together.
That means you can answer questions that used to require two tools and a lot of guesswork:
- Are the customers rating your app highly the same ones giving you high survey scores?
- Does in-app sentiment line up with what customers say after a purchase or support interaction?
- Which segments are happy in one channel but frustrated in another?
Step 5: Use AI to Monitor for Errors and Anomalies
Even well-built dashboards assume everything is working as expected—and that’s a risky assumption. Data pipelines break, behaviors shift, and unexpected patterns emerge long before they’re obvious to the human eye.
You don’t want your quarterly review to be the first time you notice.
Use tools like Advanced Dashboard’s AI Highlights to quickly check for anomalies, trends, and unexpected shifts—so you can respond while it’s still small.
Advanced Dashboard: AI Purpose-built for Feedback
Use AI-driven highlights to scan for:
- Sudden drops in satisfaction
- Spikes in churn risk
- Outlier movement by segment, region, channel, or product line
- “Impossible” changes that signal a data issue, not a customer issue
Why this matters operationally:
- You reduce the time between change and awareness
- Teams stop being surprised in executive reviews
- Outlier movement by segment, region, channel, or product line
This isn’t about replacing analysis. It’s about reducing the time between “something changed” and “someone noticed.”
Step 6: Set Up Automated Alerts for the Changes You Can’t Afford to Miss
Dashboards are inherently passive—they wait for someone to look. Alerts flip that dynamic by pushing insight to the moment it matters..
Alerts turn monitoring into an early warning system—especially when the business moves faster than your meeting cadence.
Set up notifications for:
- Significant NPS/CSAT drops (overall or in priority segments)
- Churn-risk spikes in high-value accounts
- Response rate declines (feedback silence is feedback)
- Negative themes trending upward (e.g., “billing,” “login,” “shipping delays”)
Design alerts with intention:
- Tie each alert to a clear action or owner
- Set thresholds that signal meaningful change, not noise
- Limit volume so alerts stay credible and trusted
Keep alerts tight and intentional. Too many, and people mute them. Too few, and you’re back to being surprised. Make sure alerts go to right people that can act on them.
Step 7: Define Reporting Cycles—and Assign Real Owners
Monitoring fails most often for a simple reason: everyone assumes someone else is watching. Dashboards get built, reports get shared, but without clear ownership, insight quietly turns into background noise.
This step ensures monitoring is operational—not optional—by tying every report to a rhythm, a decision moment, and a person who is accountable for what happens next
Define the structure:
- Who owns each report (creation, accuracy, distribution)
- Who reviews it (and when)
- Who is responsible for responding when something changes
- Which forums or meetings the data feeds into
Clarify the response path
- Who acts when metrics move
- What decisions are expected at each threshold
- How and when issues escalate
Even the best insight is useless if it has nowhere to go.
Step 8: Collect Feedback From Dashboard Stakeholders and Iterate
Dashboards don’t fail because they’re wrong—they fail because they’re hard to use, hard to trust, or hard to act on. Even accurate insights lose value if internal users struggle to apply them.
This step treats dashboard consumers as a feedback audience themselves, ensuring your monitoring system evolves with the people and decisions it supports.
Core VoC and CX metrics to track:
- “What decisions are you making with this dashboard?”
- “What do you wish you could see that isn’t here?"
- “Which alert would save you the most time?”
- “What’s confusing or slowing you down?”
Use that feedback to iterate:
- Simplify or reorganize views around decisions
- Remove charts that don’t drive action
- Add segmentation or context where confusion exists
- Refine alerts to reduce noise and increase trust
Small changes—better labels, cleaner segmentation, fewer charts with clearer purpose—can dramatically increase adoption.
Step 9: Communicate Results Continuously
Improvement that isn’t visible may as well not exist. When results aren’t shared consistently, teams lose momentum, stakeholders disengage, and the feedback loop quietly reopens.
This step ensures insight and progress stay present in the organization—not as one-time reports, but as an ongoing narrative tied to action and accountability.
A strong ongoing update includes:
- What changed (initiative or fix)
- What moved (metric trend over time)
- What it means (interpretation + segmentation context)
- What happens next (action, owner, timeline)
Communicate results in ways that:
- Reinforce that feedback leads to action
- Align teams around shared progress
- Normalize transparency—even when results are mixed
- Build confidence in the monitoring process
And don’t underestimate morale: when teams see evidence that listening leads to improvement, they keep listening.
What Happens After You Make Changes?
After making programmatic changes, organizations should do more than hope for improvement—they should prove it, track it, and respond in real time.
Dashboards are the engine. Recurring reports are the rhythm. Alerts are the safety system. Ownership is the glue.
And when all of that is in place, the feedback loop stops being a loop you “try to close.”
It becomes the way your organization runs.
Interested in seeing how Dashboard can transform your feedback?
The Roadmap to a Great Dashboard!
This e-guide is just one part of a multi-guide series and story. Use the links below to checkout the other guides!
Step 1: Setting the Foundation for an Effective Dashboard
Step 2: Measure & Benchmark for Smarter Business Decisions
Step 3: Question and Explore: Find the “Why” Behind Your CX Metrics
Step 4: Make a Change: Turn CX Insights Into Real Improvements