Alchemer Dashboard delivers real-time, AI-powered insights that drive smarter decisions. Get a complete and actionable view of what's working (and what’s not).
Feedback data is everywhere—but turning it into clear, timely decisions is still hard. Teams are often exporting to spreadsheets, piecing together static reports, or relying on complex BI tools just to understand what’s working and what isn’t.
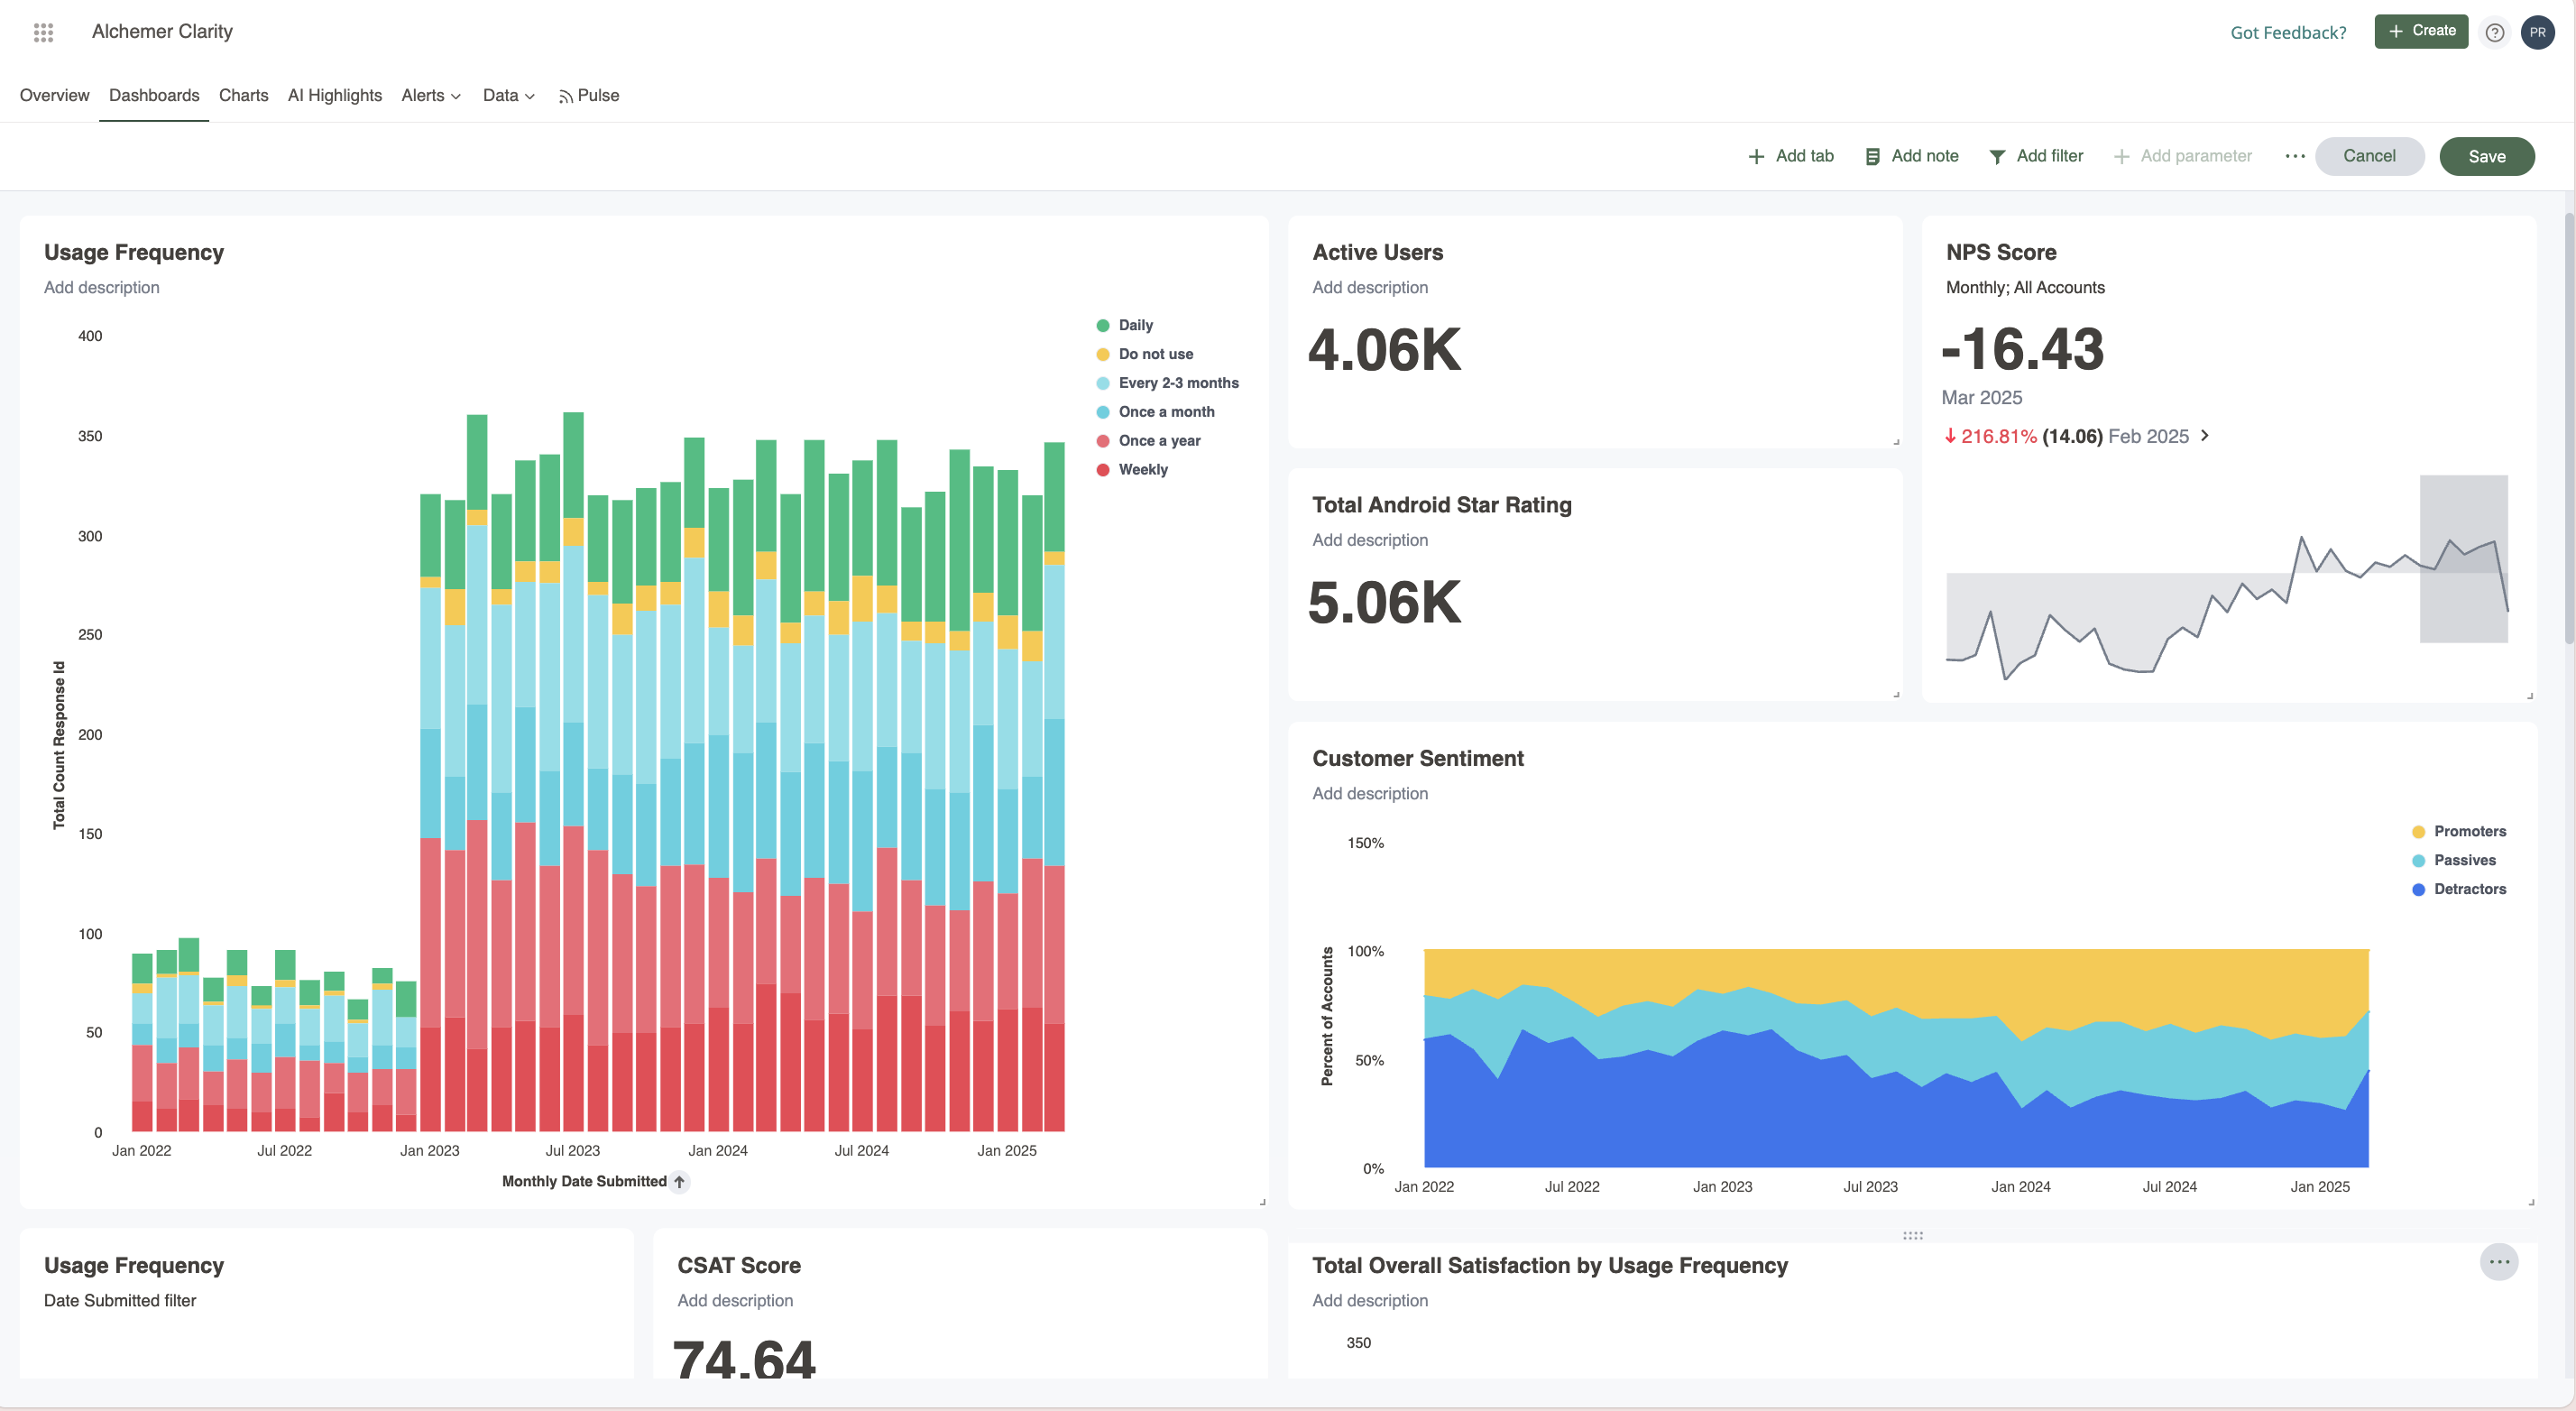
unified feedback analysis
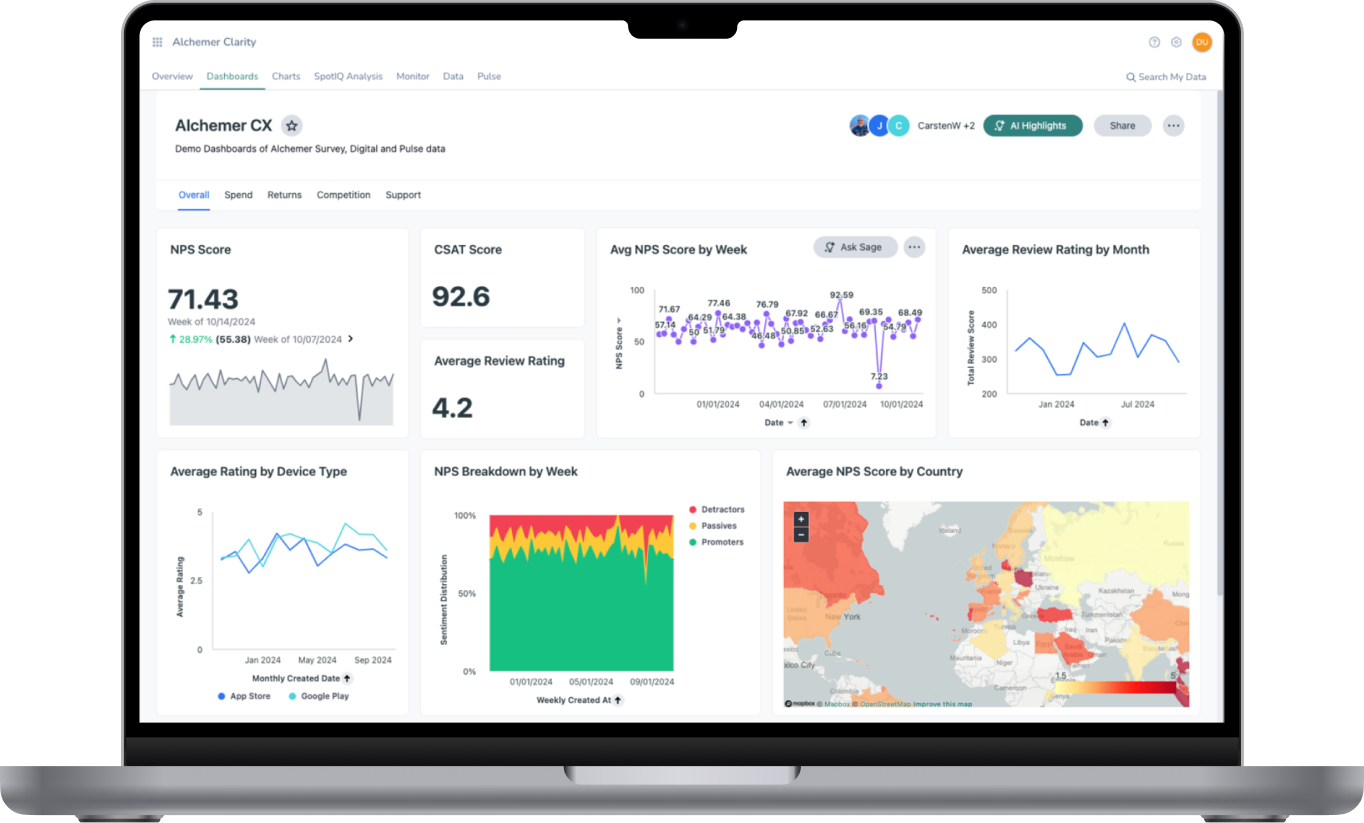
Get the picture (and answers) in one place
Alchemer Dashboard transforms your feedback into real-time visualizations that anyone can explore. Designed for speed, simplicity, and accuracy, Dashboard connects feedback coming from surveys and other data sources—giving every team a complete, actionable view of what’s happening right now.
Keep stakeholders aligned with live, shareable dashboards
Marketing and Research
Measure brand sentiment and campaign performance with interactive visual storytelling.
Impact:
Prove ROI with linked feedback and business metrics
Align teams quickly with shared visual dashboards
Optimize targeting with segmented, interactive views
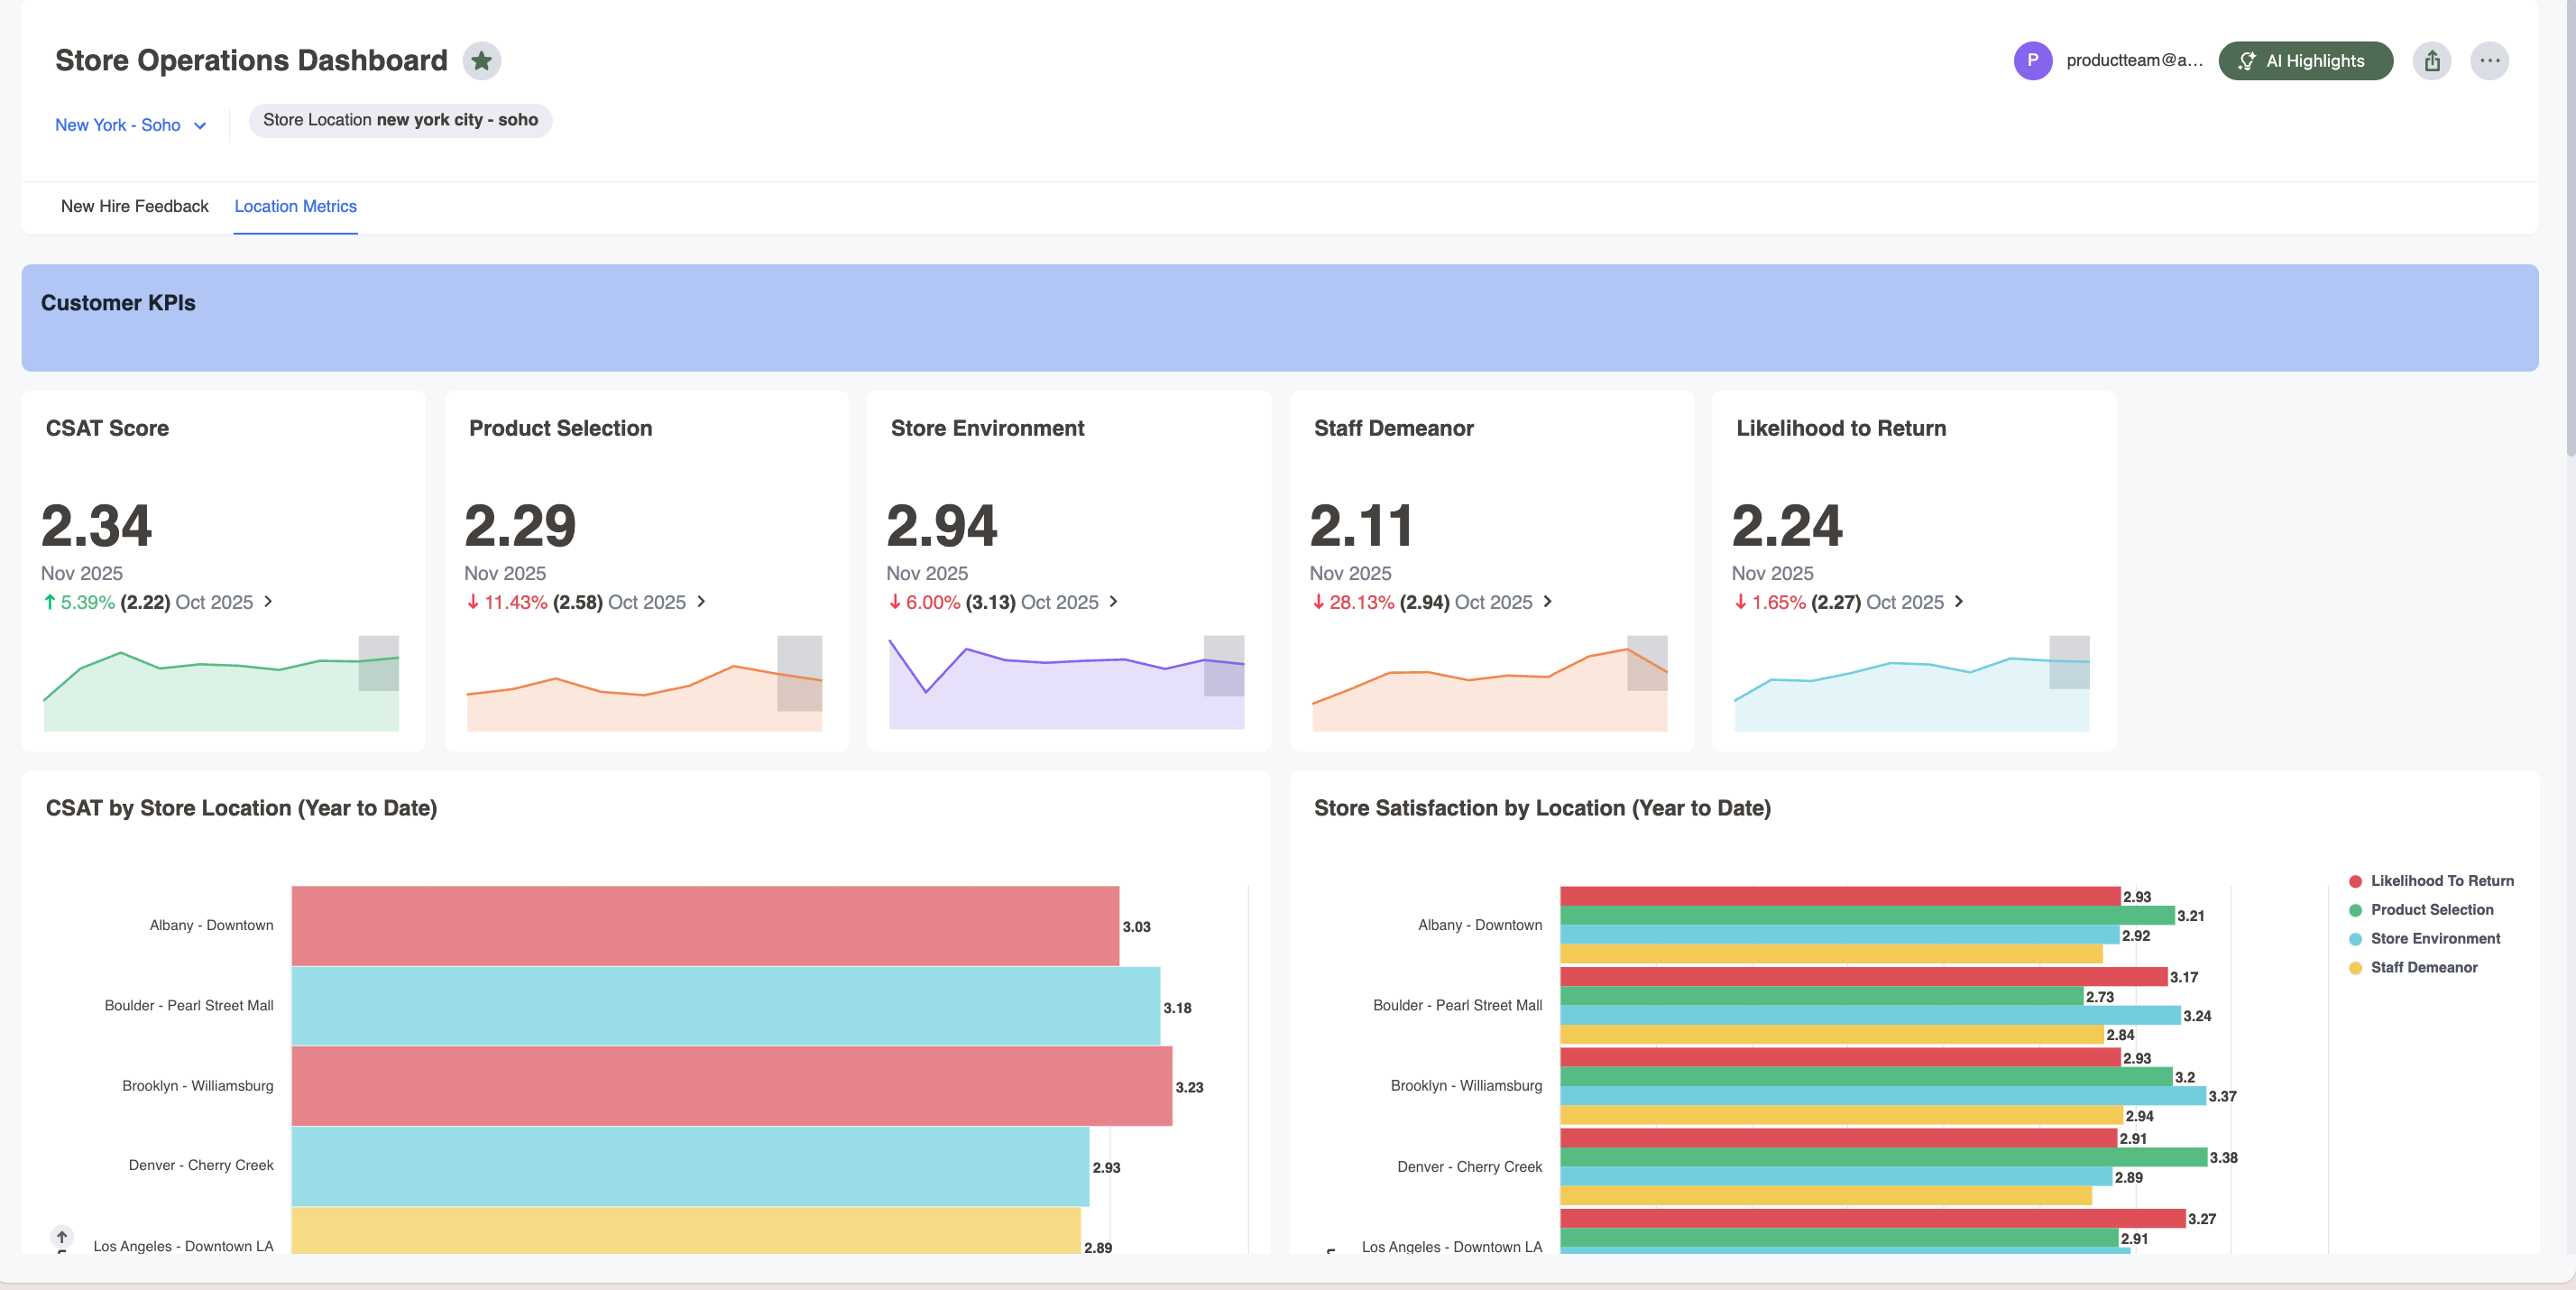
Operations and Support
Detect anomalies in performance metrics and customer issues faster—before they impact your bottom line.
Impact:
Identify and resolve issues in near real time
Trace performance gaps to their source
Improve efficiency with scheduled and filtered reporting
Product Teams
Visualize feature feedback, prioritize enhancements, and spot usage trends before they become issues.
Impact:
Prioritize product improvements with real data
Shorten time-to-decision and release cycles
Increase team alignment with transparent, real-time dashboards
Join 11,000+ companies TRANSFORMING their business with Alchemer
Advanced AI features
AI that illuminates your data
Alchemer Dashboard’s AI features help you move past static charts to the insights that matter. Instead of hunting for patterns manually, AI surfaces trends, explains what changed, and identifies root causes—so teams of any skill level can get to answers faster.
AI features to accelerate analysis:
Ask questions in plain language so anyone can get answers fast
Surface trends, anomalies, and outliers automatically
Use KPI alerts and change analysis to know what needs your attention
Dashboard brings your feedback and business data into one self-service view—so anyone can explore trends, spot issues fast, and act with confidence in real time.
Connect your data sources
Connect Alchemer survey results and key business data to create a unified, trusted place for insight.
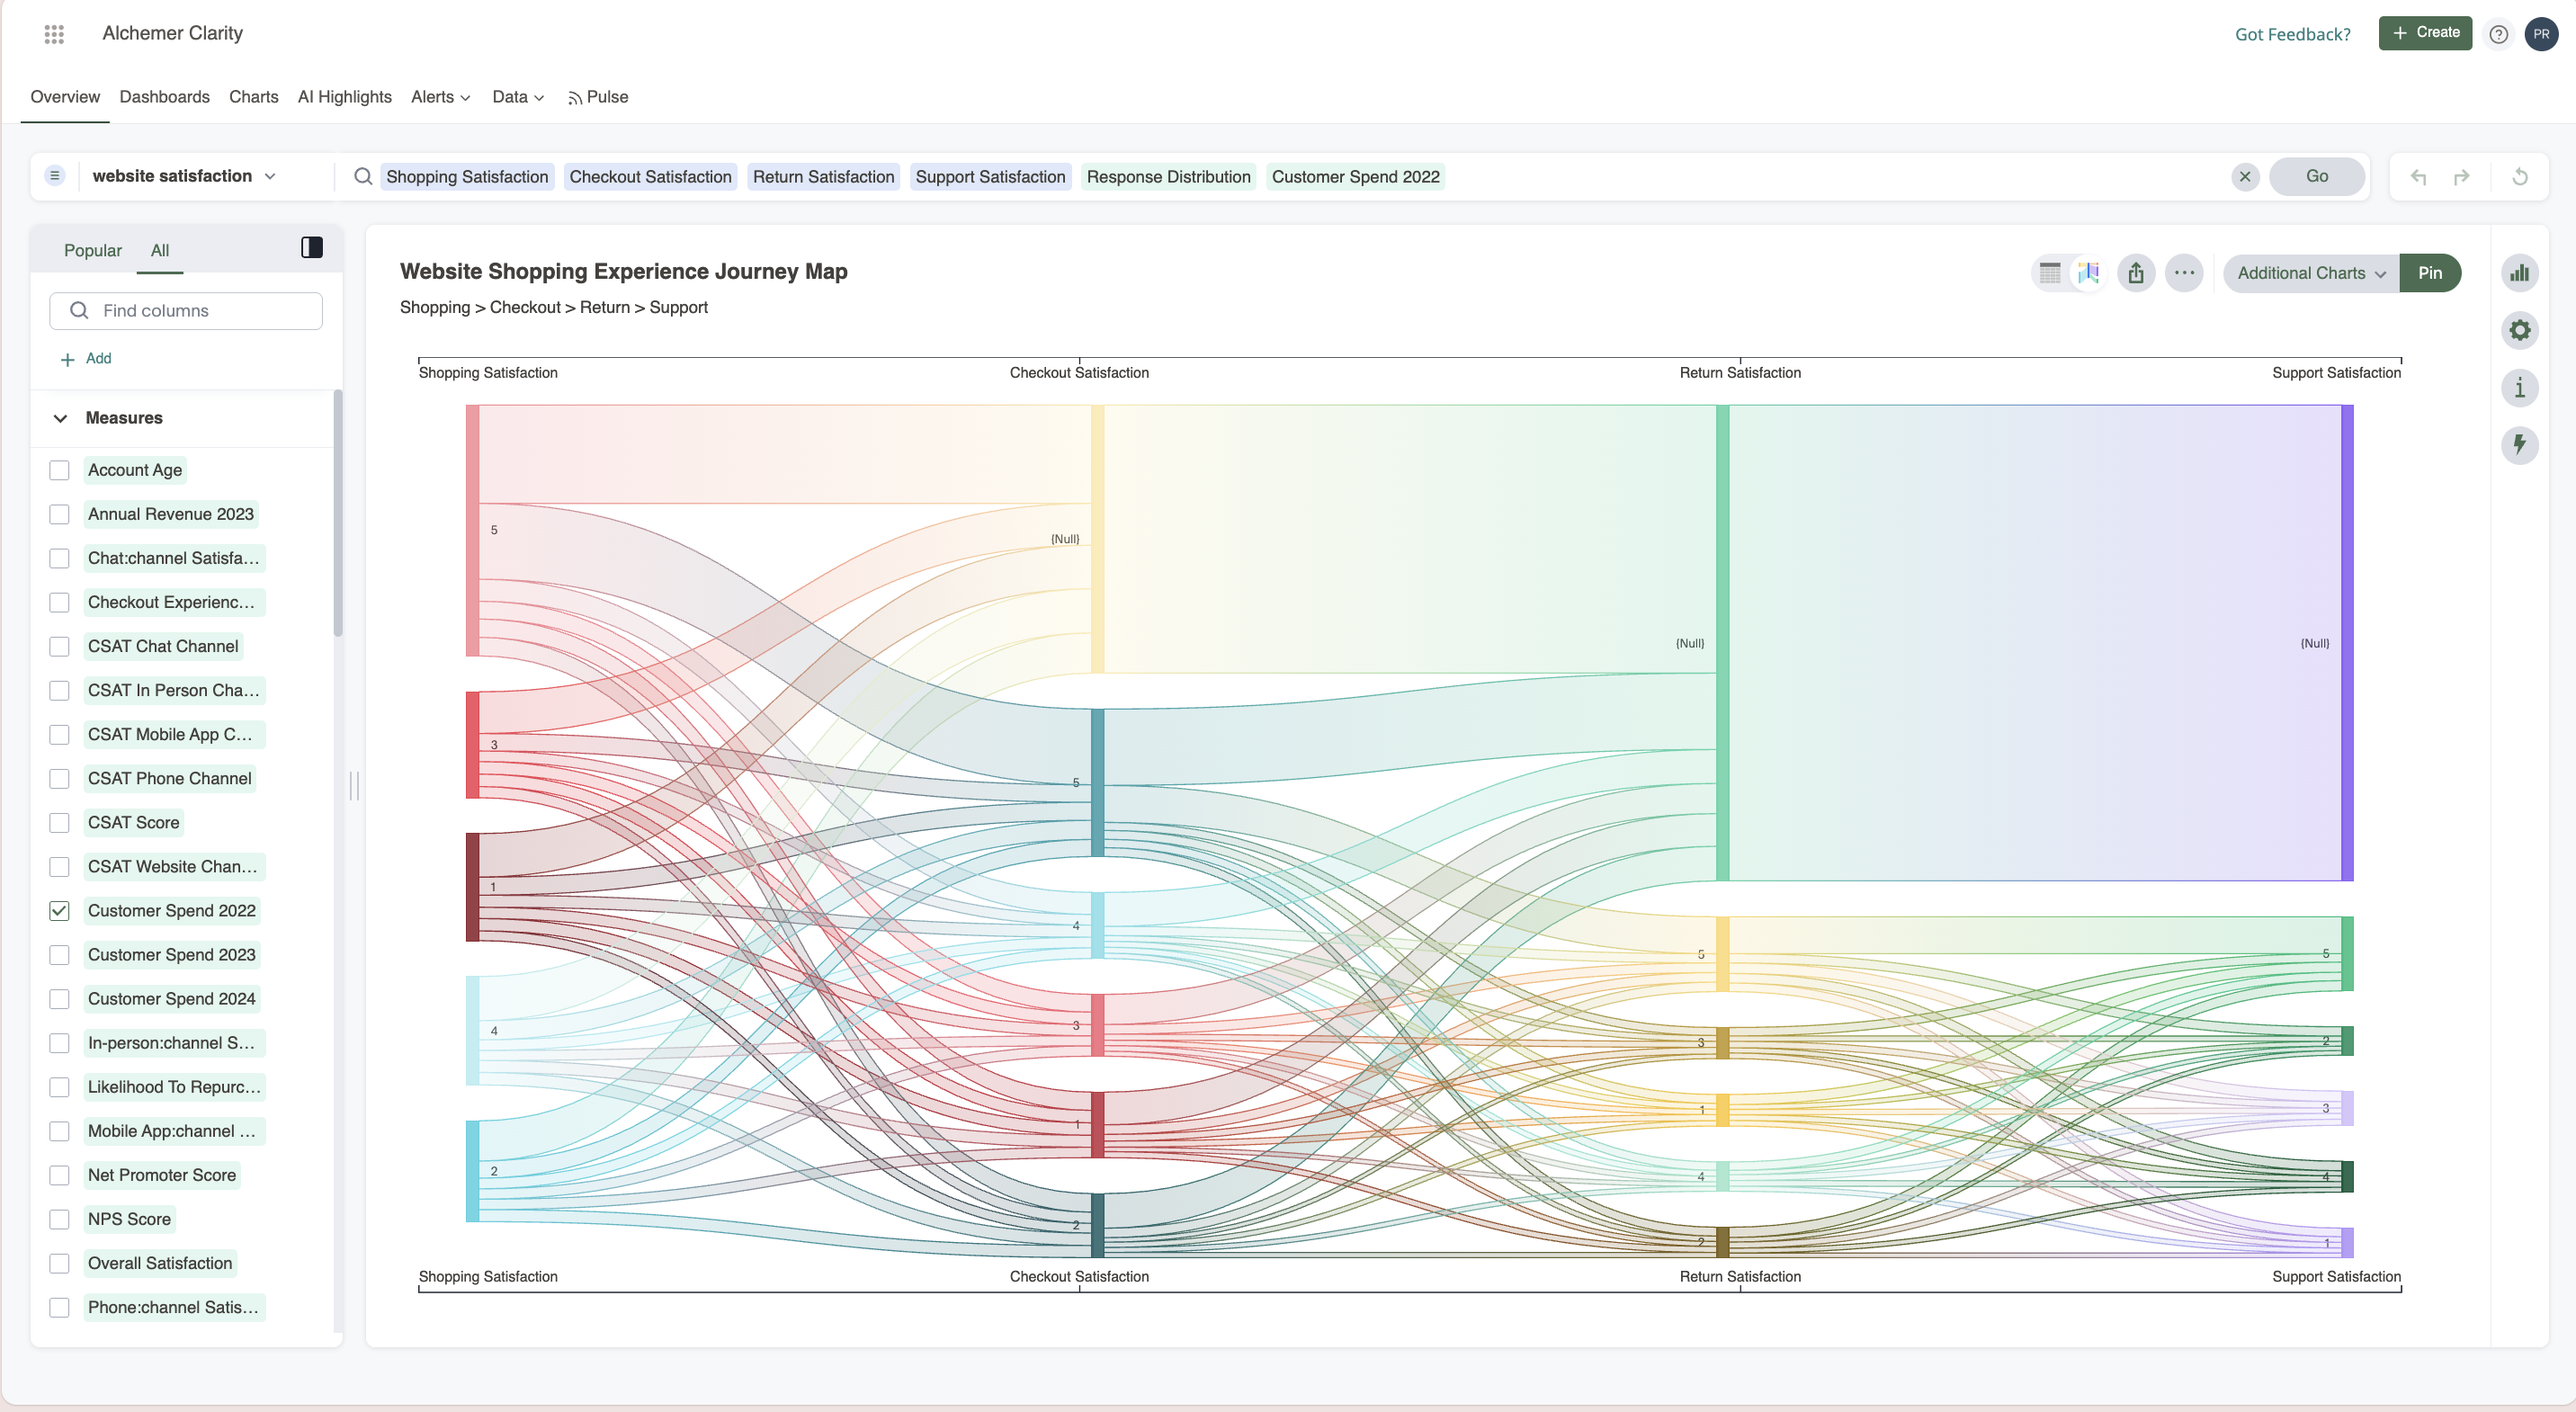
Build dashboards in minutes
Use the flexible chart builder to visualize what matters most—CSAT, NPS, engagement, churn signals, and more.
Explore and filter with ease
Slice results by team, location, segment, time period, or any attribute you track to uncover the “why” behind the numbers.
Share insights automatically
Give stakeholders real-time access or schedule recurring updates, so everyone stays aligned without manual exports.
“We're putting incredibly powerful analytics into the hands of everyone, not just data scientists. It's all about faster insights, smarter decisions, and real impact, right out of the box."
— Ryan Tamminga, Alchemer’s SVP of Product
the alchemer difference
Why Alchemer Dashboard?
Turn feedback into insight, faster than ever before
Full visibility
See all your feedback in one clear, live view, so patterns and problems stand out quickly and your team can make decisions faster with the full context in front of them.
Easy to use
With drag-and-drop widgets, flexible layouts, and reusable views, you can publish what matters fast without a BI specialist in the middle. That means more people can explore data confidently, get answers on their own, and keep momentum moving forward.
Fast, AI-powered insights
AI features let you ask questions in plain language and get clear explanations of trends, anomalies, and root causes—so you know what’s driving results and what to do next.
Sharable & secure
Give teams and leaders the views they need with role-based access and governance built in—keeping sensitive data protected while collaboration speeds up.
Ready to see your feedback come to life?
Transform survey and feedback data into interactive, decision-ready visuals that drive business impact.