- Resource Library
- E-guides
- Measure & Benchmark for Smarter Business Decisions
Guide 2: Measure & Benchmark for Smarter Business Decisions
Establish Baselines, Track Trends, and Benchmark Against the Best

Intro
You already have plenty of data—dashboards, charts, reports, and spreadsheets scattered across your different tools and systems. What you may not have is the clarity that turns all that information into action.
That’s because data alone doesn’t drive decisions. Benchmarking does.
Benchmarking adds essential context to every metric, whether you’re focused on marketing, customer experience (CX), support, or sales. A conversion rate only becomes meaningful when you know how it stacks up against expectations. A CSAT score matters only when you know what “good” actually is. And a store or team is “underperforming” only when you have something reliable to compare it to.
In this guide, you’ll learn how to:
- Build internal benchmarks that ground your decision-making
- Track performance trends that reveal what’s improving—and what isn’t
- Compare your results to industry standards with confidence
- Use AI-powered dashboards to surface insights automatically
- Identify opportunities, accelerate improvements, and communicate results clearly
Establish Your Baseline and Identify the Metrics that Matter
Before you compare yourself to anyone else—or even to your own goals—you need a clear picture of where things stand today. Think of this as the foundation of the house. Everything you build later depends on how solid this first layer is.
1. Choose the Metrics that Matter
Start by identifying the KPIs that genuinely reflect how your business is performing. Avoid vanity metrics—focus instead on what truly drives decision-making and tells a story about growth, satisfaction, or risk. Start with the customer voice at the center. Key survey-driven metrics include:
- Net Promoter Score (NPS) or Customer Satisfaction (CSAT)
Use surveys to break these down by customer type, plan, or lifecycle stage. Are enterprise customers less satisfied than SMBs? Do new users rate you differently than long-time customers? - Survey response rates and completion trends
Understand who’s engaging. A dip in response rate from a key segment may signal disengagement—and an opportunity to re-engage. - Churn Signals from Survey Responses
Track how low scores or common complaints correlate with churn in the next 30–90 days. Use as an early warning for retention risks.
2. Pick a Cadence and Commit
Choose a regular rhythm for collecting and reviewing customer feedback. Some options:
- Transactional surveys (e.g., post-support or post-purchase): Review weekly or monthly to stay close to real-time sentiment.
- Relationship or quarterly NPS surveys: Track trends over quarters and year-over-year.
- In-product or lifecycle-triggered surveys: Revisit monthly to assess onboarding and retention health.
Consistency ensures you catch meaningful trends instead of reacting to outliers.
3. Establish a Baseline Before Making Changes
Before you roll out a new feature, adjust prices, or overhaul a process, freeze-frame your current performance. Take a “before” snapshot of NPS, CSAT, and the top customer themes. Filter by product, region, or segment to create a clean baseline.
This baseline becomes your control. When the change launches, you can compare the “after” with confidence.
Once your baseline is set, use your dashboard tool to compare:
- Your current performance vs. your historical baseline
- One customer segment vs. another
- Your business vs. industry standards
This view is where insights are found A 72% onboarding satisfaction score might look acceptable—until you see that it sits below your historical average, below your SMB segment, and below the industry benchmark.
The Software Company That Thought Their Rollout Was Smooth
A SaaS company with 60+ regional sales offices launched a new onboarding flow. Early usage numbers looked normal. Marketing felt good about the rollout. But once they compared the onboarding CSAT to the pre-launch baseline, a different story emerged.
Scores dropped 11 points among new enterprise customers. The issue wasn’t the workflow itself—it was that training materials hadn’t been updated in time for enterprise admins. SMB customers didn’t skip a beat, but enterprise teams were flying blind.
Because they had a reliable baseline, the discrepancy jumped off the page.
The ops team closed the training gap, and within a month, scores not only recovered—they surpassed the original benchmark.
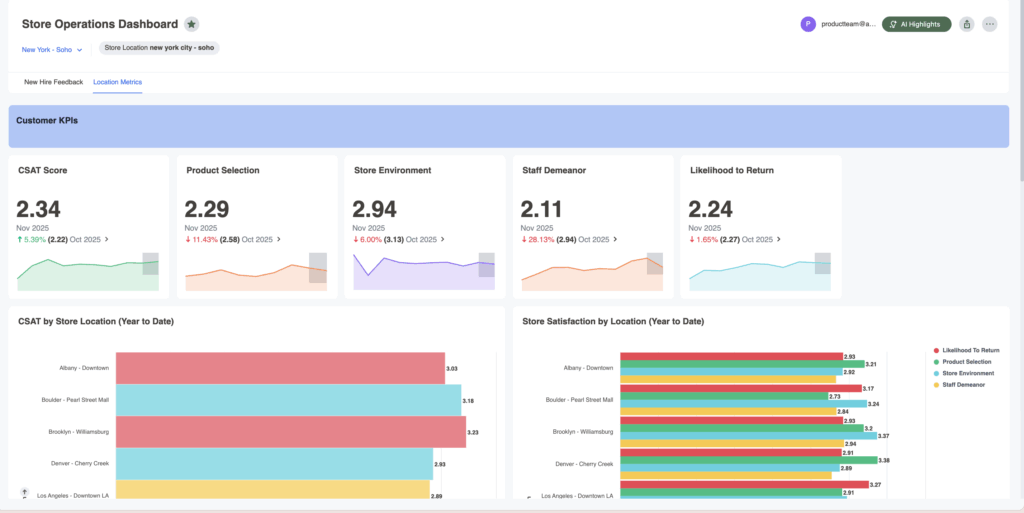
Alchemer Dashboard: Turn Feedback Into Results
Alchemer Dashboard delivers real-time, AI-powered insights that drive smarter decisions. Get a complete and actionable view of what’s working (and what’s not):
- A Complete View = Action: Easily build and customize your dashboards, connecting feedback with business data so you can act decisively.
- Turn Feedback into Business Impact: Transform feedback into dynamic, real-time insights that drive measurable outcomes. Don’t rely on static reports – instead, uncover actionable intelligence.
- AI-Powered Insights, Instantly: As easy as typing a question—and boom—gain deep analytical insight, without the hassle of complex BI tools. Powerful, AI-driven insights that empower everyone to explore data, uncover trends, and act right away.
Benchmark Against the Industry
Once your internal view is clear, it’s time to look outward. Industry benchmarks help you answer a question every leader asks—“Is this good?”—and sometimes “Are we falling behind without realizing it?”
Your internal scores might be trending upward, but without external comparison points, you don’t know whether you’re improving faster than the market or just treading water.
Use industry benchmarks to:
- Understand how your NPS, CSAT, response rates, and churn indicators compare to companies like yours
- Identify where you’re excelling and where competitors may be pulling ahead
- Set realistic, market-aligned goals instead of relying solely on internal history
You can pull from broad CX studies or specialized industry reports, depending on your sector and customer base. Sources include:
- Third-party benchmark reports
- Sector-specific CX and satisfaction studies
- Analyst and competitive intelligence reports
- Open indices and publicly published CX scoring
Modern dashboard tools streamline benchmarking by merging your data with external insights and surfacing patterns automatically. AI can help you:
- Detect gaps vs. industry averages
- Identify strengths and outliers in your data
- Highlight opportunities where improvement creates outsized impact
Benchmarking gives your team the confidence to act quickly and the clarity to communicate results persuasively.
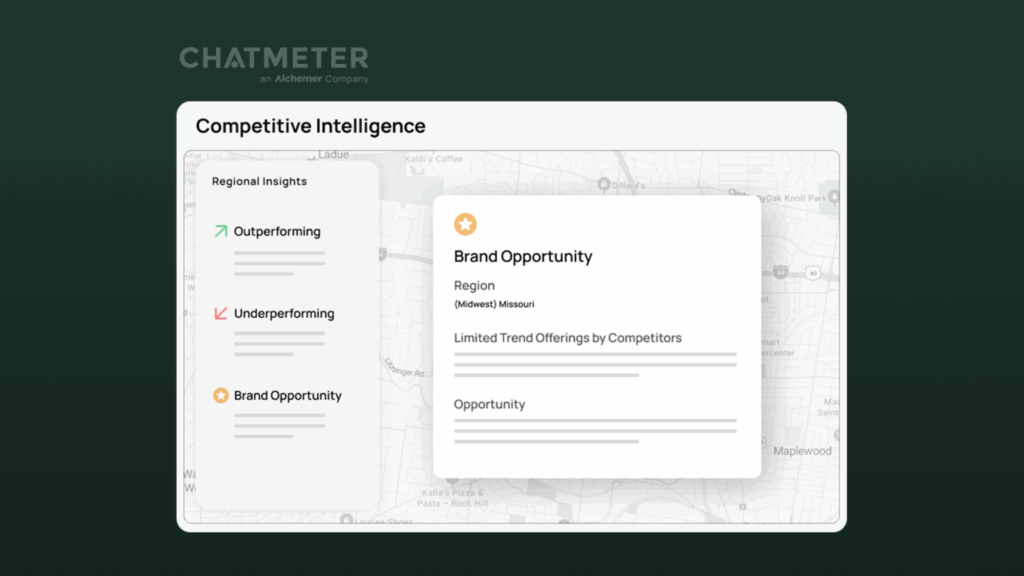
Benchmarking Against Specific Competitors
Alchemer by Chatmeter gives you the competitive intelligence to measure your performance against specific rivals—so you can see where you’re winning, where you’re falling behind, and what to do next.
- Compare the metrics that matter most—ratings, sentiment, and review volume —against named competitors.
- Track performance gaps over time to spot whether you’re closing distance, losing ground, or pulling ahead.
- Pinpoint why competitors are outperforming you by drilling into themes, locations, and customer comments.
- Benchmark at any level—brand-wide, region, store/location, or product/service line—to focus improvements where they’ll move the needle.
What Happens Next?
Refine and Track Progress
Benchmarking only becomes powerful when it’s repeated. Tracking changes over time helps you confirm whether initiatives are working, spot early warning signs, and recognize long-term trends that may not be visible in snapshots.
To refine and track effectively:
- Build dynamic dashboards to monitor changes
- Use real-time alerts to catch emerging issues
- Set targets based on your knowledge of industry performance
- Adjust your strategy as market trends shift
Communicate and Set Expectations
Benchmarking drives results when teams understand the insights and know how to act on them. Clear communication turns data into alignment, accountability, and confidence.
Ways to communicate impactfully:
- Share benchmark findings across teams to guide strategy
- Use AI-powered recommendations to optimize pricing, product, or CX
- Include visualizations—trend lines, comparisons, control charts—to simplify insights
- Revisit benchmarks regularly to keep goals aligned with market reality
Start Turning Feedback Into Results
If your goal is to benchmark and act on feedback—not just collect feedback—Alchemer Dashboard is the tool that gets you there. Stop waiting on delayed reports or trying to stitch together siloed data. With always-on, connected insights, you can track performance over time, compare teams, products, or regions, and see exactly where you lead, where you lag, and what to fix next.
Interested in seeing how Dashboard can transform your feedback?
The Roadmap to a Great Dashboard!
This e-guide is just one part of a multi-guide series and story. Use the links below to checkout the other guides!
Step 1: Setting the Foundation for an Effective Dashboard
Step 3: Question and Explore: Find the “Why” Behind Your CX Metrics
Step 4: Make a Change: Turn CX Insights Into Real Improvements
Step 5: Using Dashboards to Drive Change
Learn how to establish baselines, track trends in real-time, and benchmark against the best.