- Brand & Reputation Management
From reviews to revenue: Turning feedback into onsite-level fixes
Every customer interaction — from a Google review to a five-star mention on social —...
- Brand & Reputation Management
GEO is the new battlefield: How multi-location brands can adapt to AI-driven discovery
Generative Engine Optimization (GEO) is redefining search visibility for multi-location brands by determining how—and if—AI engines surface...
- AI, Alchemer Dashboard
How to build a dashboard that sets your team up for success
Most dashboards fail because they are built backward, by starting with the “What” instead of the “Why.”...
- AI, Brand & Reputation Management
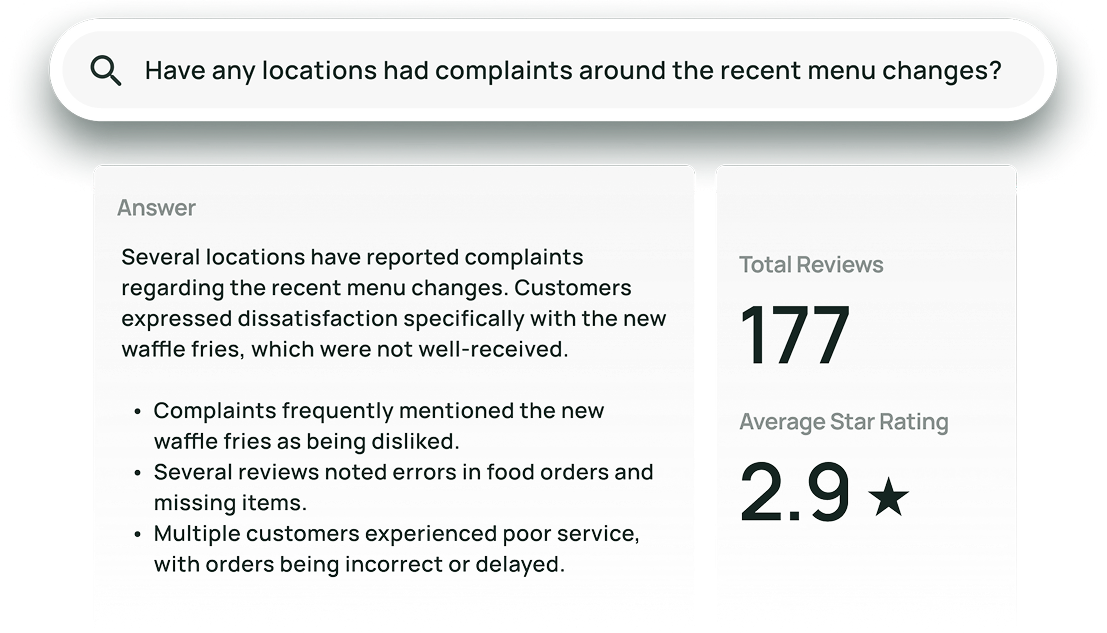
6 ways Alchemer brings AI-powered customer intelligence to multi-location brands
AI is now a standard feature in customer experience and reputation management platforms. But for...
- AI, Alchemer Dashboard
Alchemer Dashboard: AI that is purpose built for customer feedback
Customer feedback is only valuable if you can act on it. But too often, insights are...
- Brand & Reputation Management, Customer Experience
The local listings checklist every multi-location business needs
For multi-location businesses, local listings aren’t a “set it and forget it” task. They’re a foundational layer of your...
- CX
Before you re-sign: A renewal checklist every Qualtrics customer should review
Renewals have a way of sneaking up on teams. One minute you’re heads-down collecting feedback, the next you’re reviewing a...
- Customer Experience, CX
Alchemer vs. SurveyMonkey: Compare features, integrations & analytics
Introduction – Choosing the right survey platform at scale When your organization needs a customer or...
- Customer Experience, Customer Feedback
Alchemer vs. Medallia: Which platform fits your organization best?
When evaluating customer experience (CX) and feedback platforms, Alchemer vs Medallia is a common comparison – and for good...


