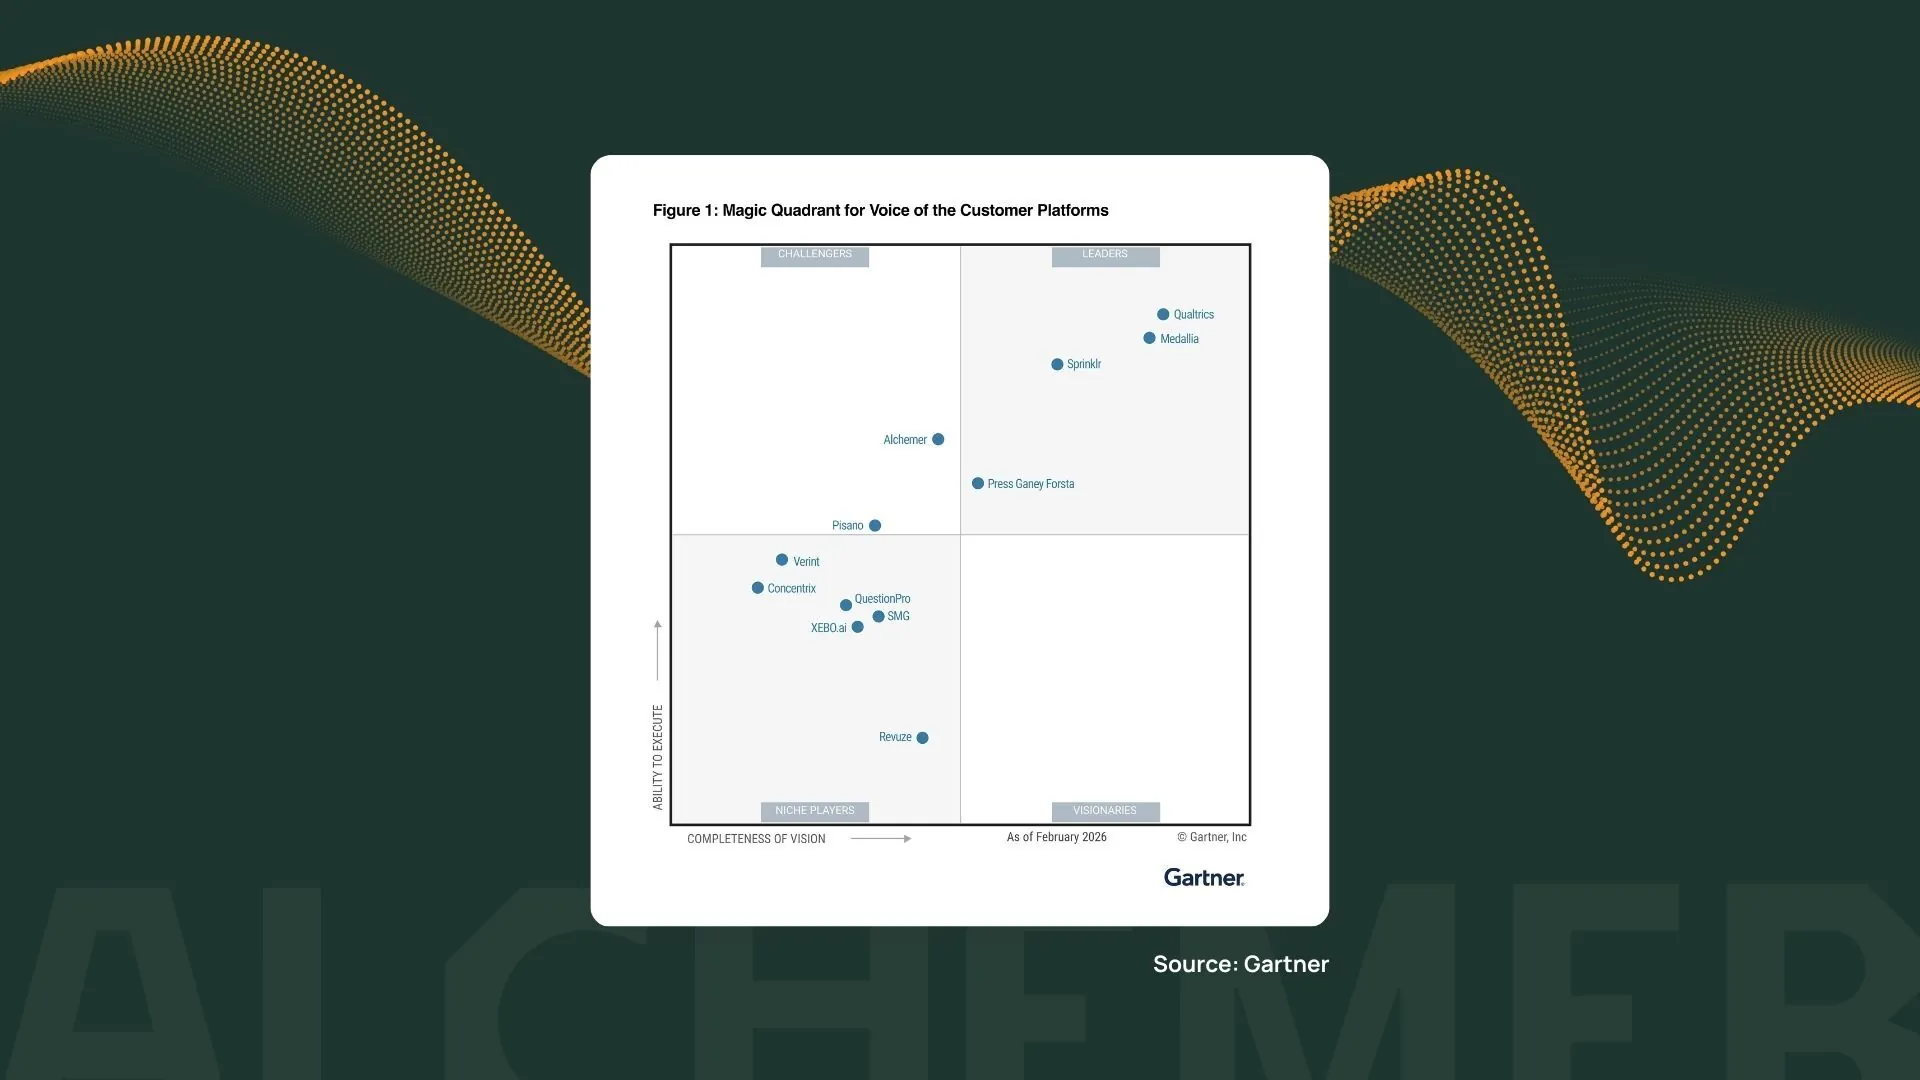
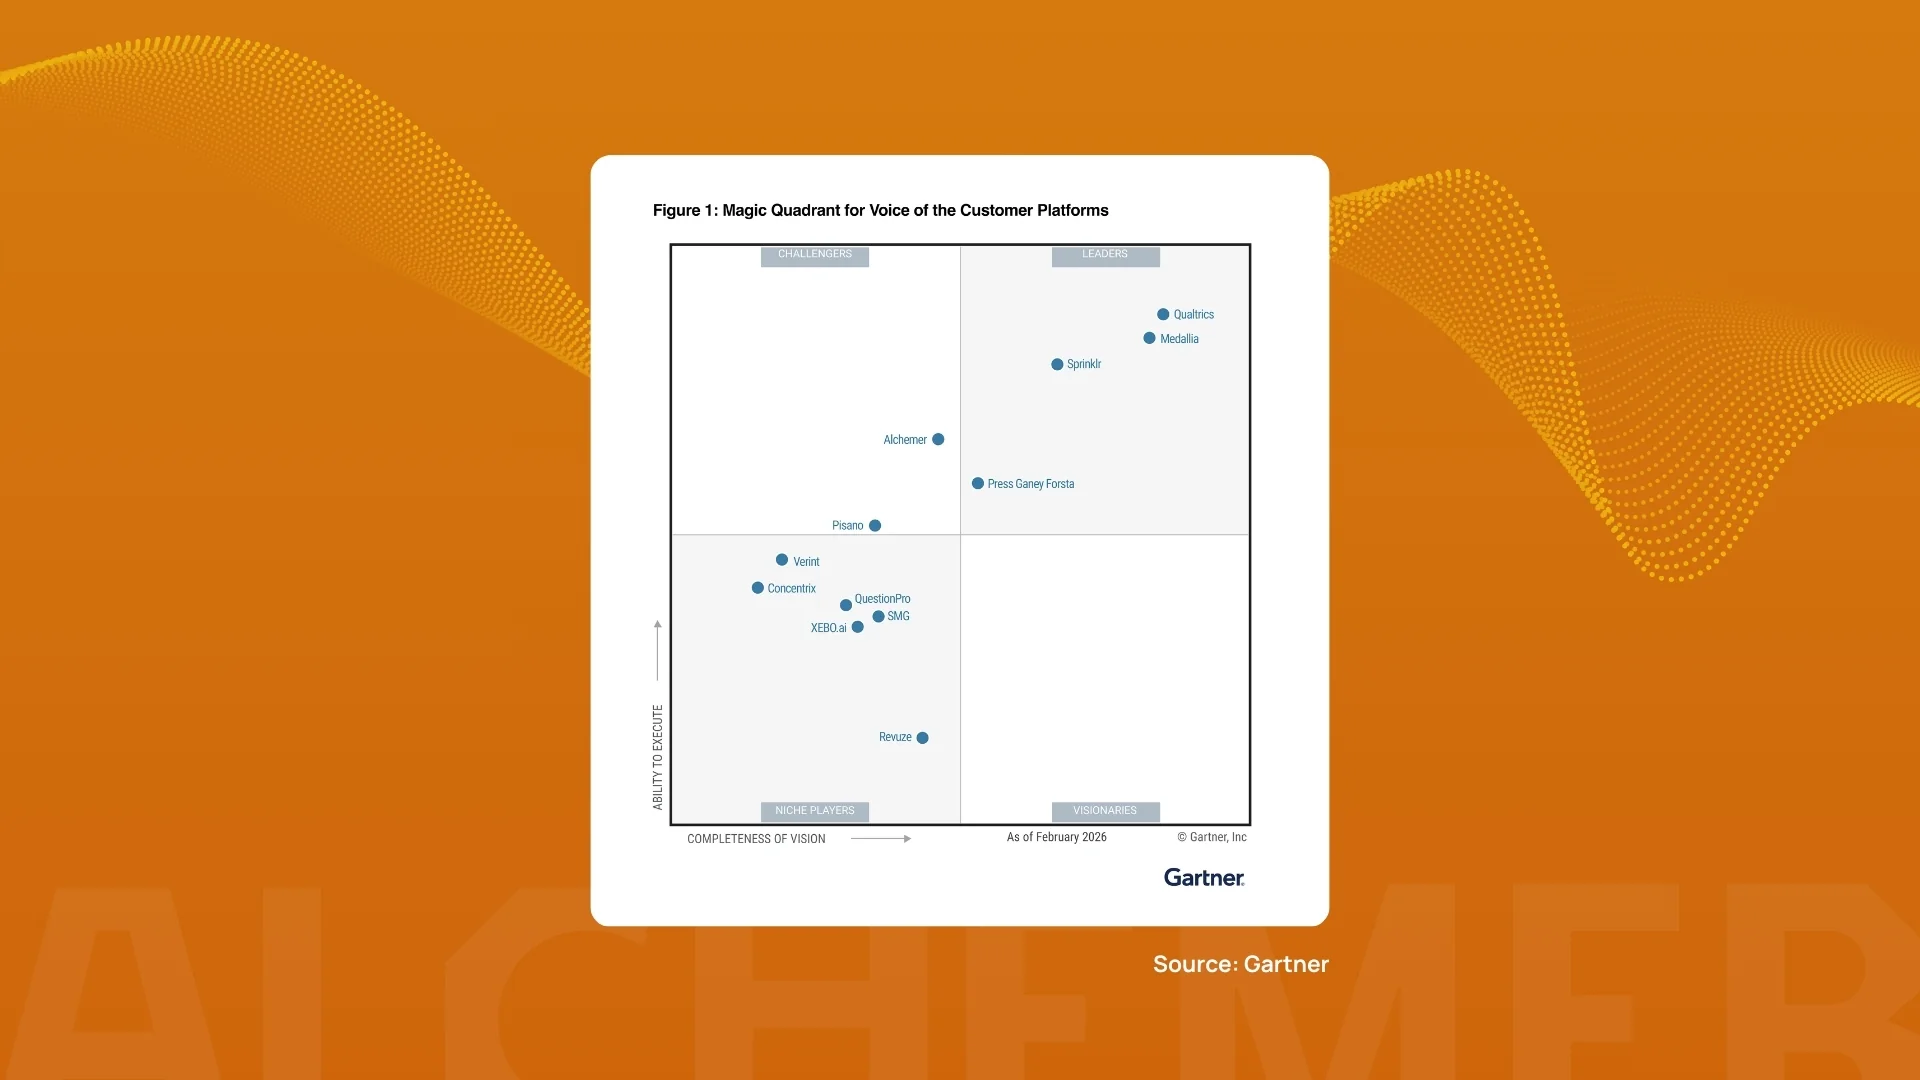
A person wearing a checkered shirt speaks into a microphone in front of a group of seated people at a long table. The setting appears to be an outdoor patio with string lights overhead. The audience is listening attentively.
Illustration of six diverse avatars in colorful overlapping circles, representing various genders and ethnicities. The background includes small decorative dots in green, blue, and red.
Red icons on a white background show a flowchart with a person, organizational chart, documents with a profile, folders, and gears, indicating a process related to management or human resources. Dotted circular arrow surrounds the elements.
A double-exposure image of a city skyline with a silhouette of a person raising their arms and holding a shopping bag, symbolizing celebration, urban shopping, and Closing the Loop with Customers.
A digital collage showing white gears and arrows overlaid on a blurred image of people working at a desk with laptops and papers, representing teamwork, technology, workflow processes, and taking feedback into action.
A group of six people sit around a white table in a bright office, discussing information displayed on a computer monitor. Sticky notes cover the wall behind them, and a yellow laptop and notebooks are on the table.
A smartphone screen displaying the DD Perks app with points and an offer for $1 off a dozen donuts. In the background, the exterior of a Dunkin Donuts store is visible.
A person’s hand interacts with a virtual interface displaying six award badges from G2, labeled High Performer, Most Implementable, Fastest Implementation, and Leader for Enterprise and Small Business, all for Fall 2019.
Text on an overlapping layered background reads: “You can’t transform something you don’t understand. If you don’t know and understand what the current state of the customer experience is, how can you possibly design the desired future state?”—Annette Franz.
Hands typing on a laptop keyboard with digital icons of faces, stars, and checkboxes floating above, symbolizing online reviews or customer satisfaction feedback.
Start making smarter decisions
A dashboard with sections Build, Style, Test, Share, Results, and Tools. It shows test project details, including estimated length of 11 minutes, fatigue score, and accessibility. Buttons offer options to generate test data and invite others.
Get your monthly dose of Alchemer insights!
Each month, we’ll bring you expert tips, valuable resources, and fresh ideas to help you turn insights into action and drive your organization forward.

Subscribe to our Blog