
Collect the best feedback with Alchemer Survey
Collect in-moment feedback with Alchemer Mobile
Close the feedback loop with Alchemer Workflow


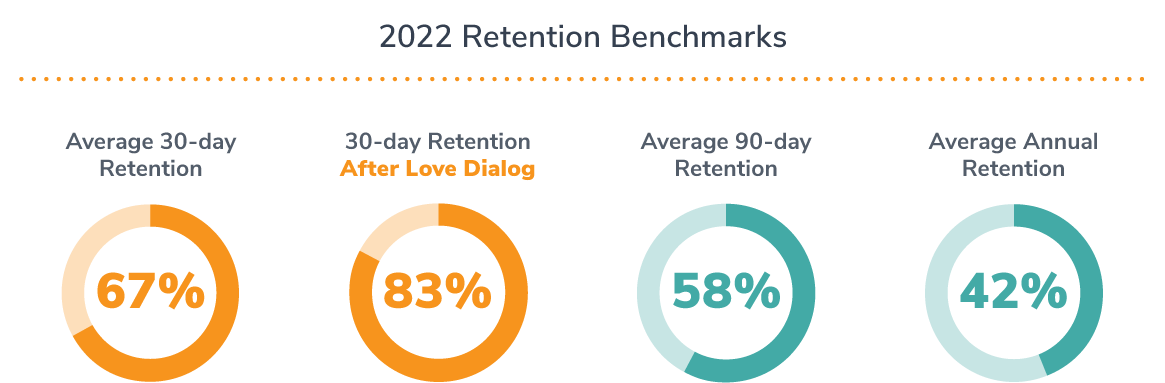
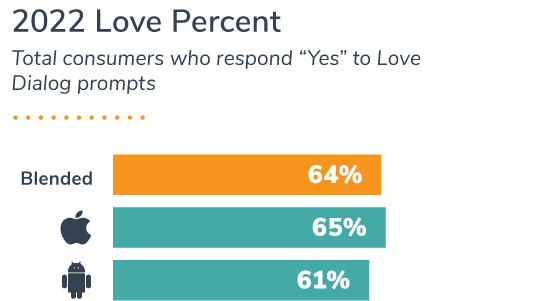
Alchemer Mobile’s benchmark for 30-day retention is 67% —seven times the industry standard, standard, according to Business of Apps, driven by proactive consumer engagement.
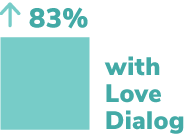
When consumers engaged with an Alchemer Mobile Love Dialog in the first 30 days, retention went up to 83% on average.

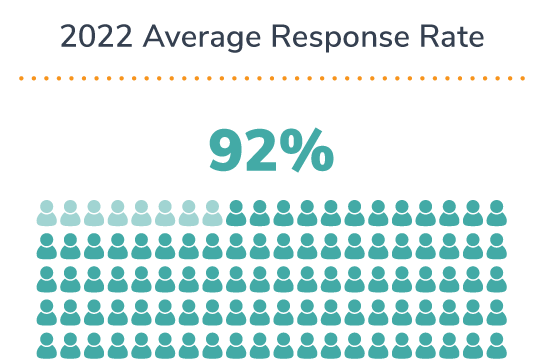
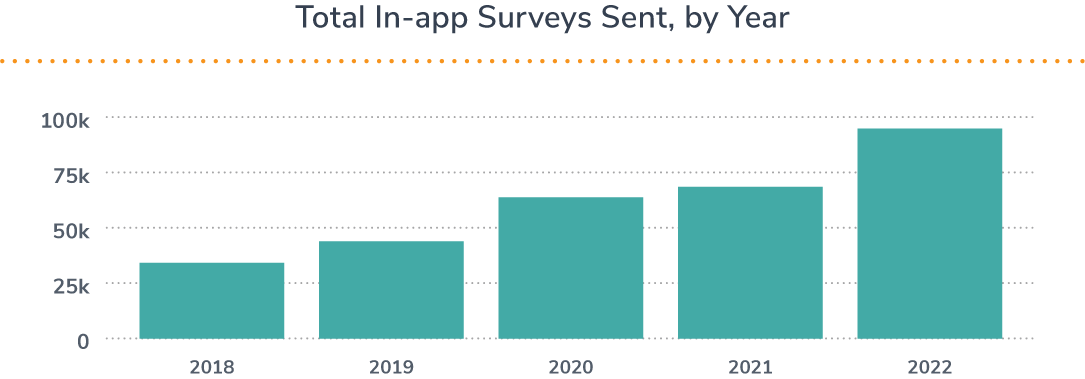
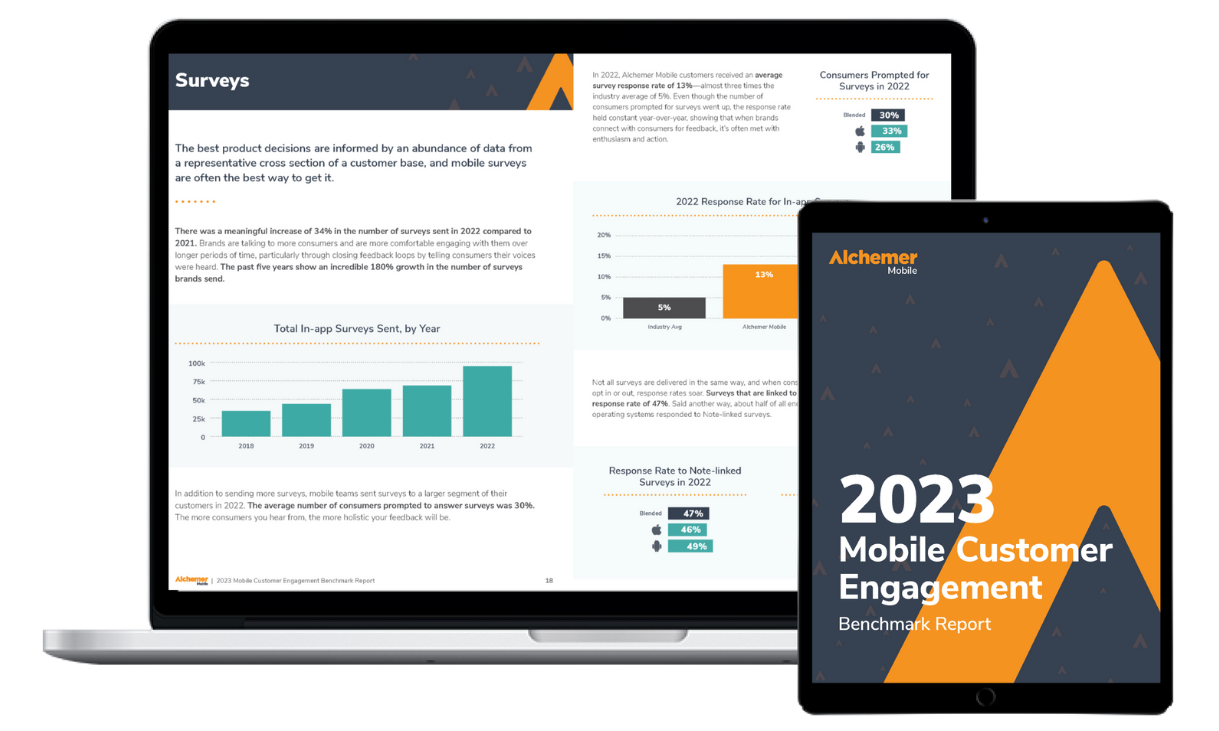
The number of mobile surveys brands send to consumers has increased 180% over the past five years but response rates have stayed consistent, indicating that consumers will share feedback when asked for it.
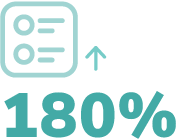
Number of in-app surveys brands send to consumers has increased 180% over the past five years but response rates have stayed consistent, indicating that consumers will share feedback when asked for it.
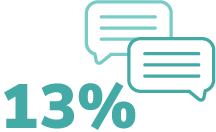
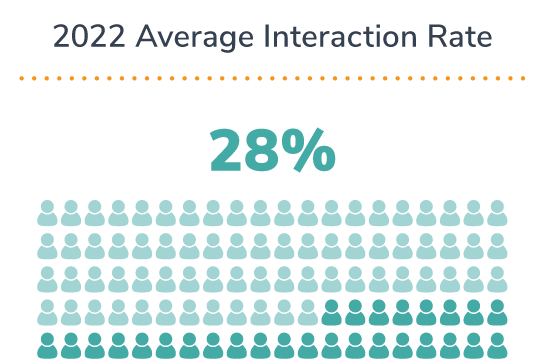
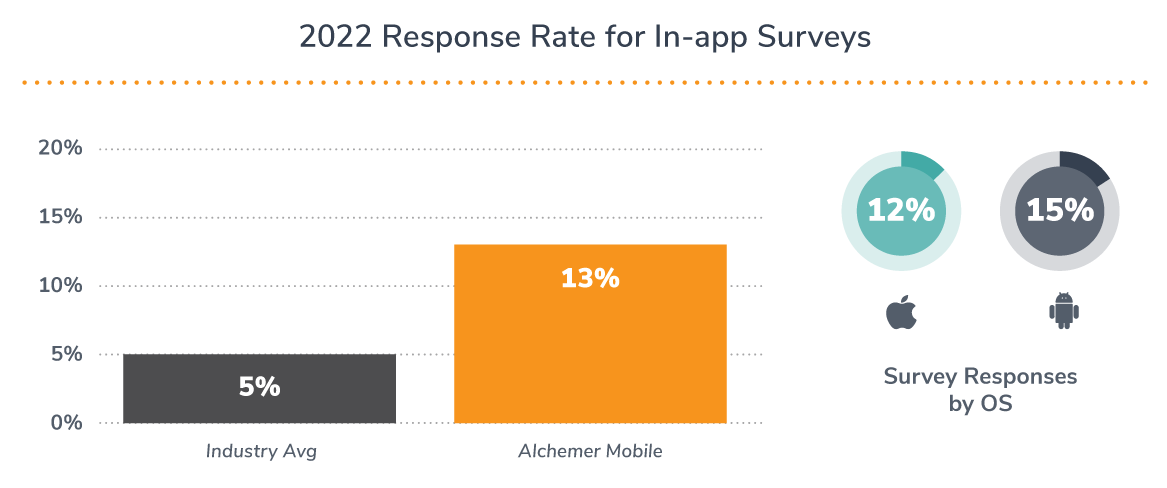
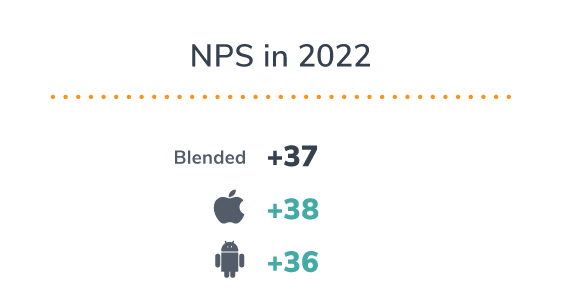
Alchemer Mobile’s benchmark for in-app survey response rates is 13% —much higher than the industry average of average of 5%, according to Business of Apps.
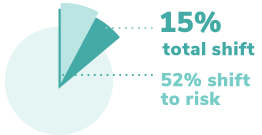
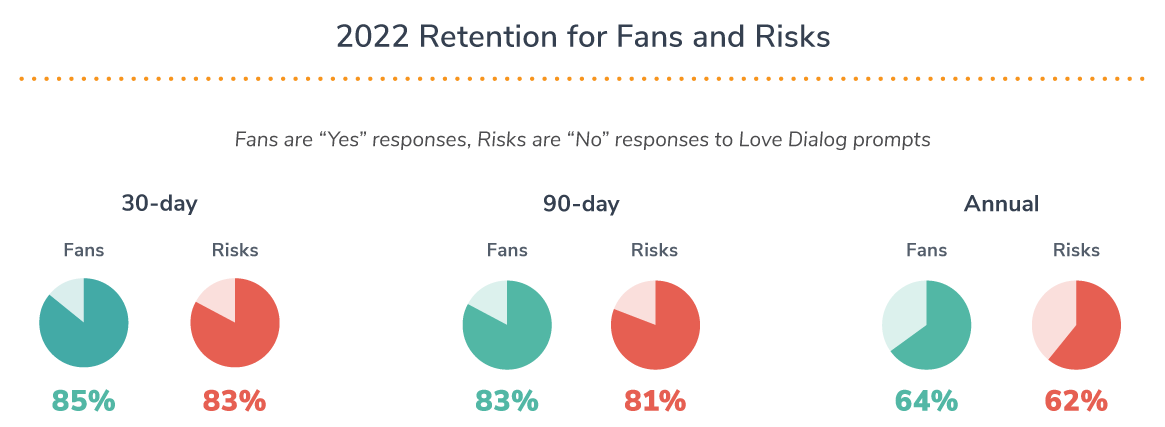
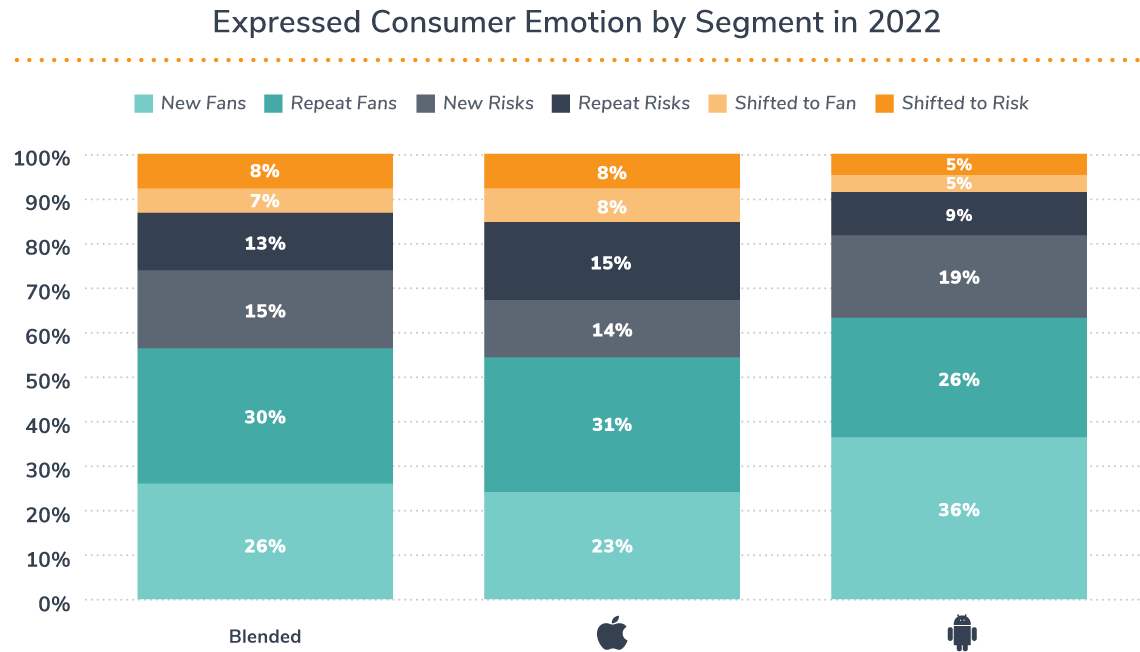
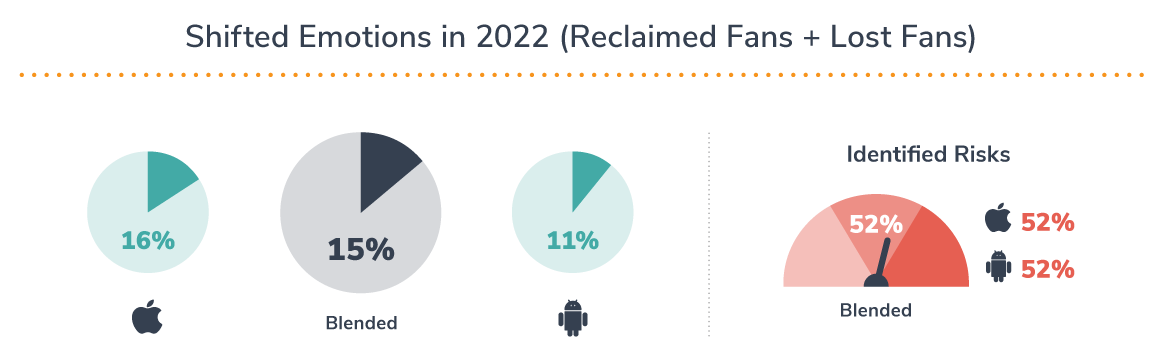
15% of consumers shifted their emotions between Fan and Risk audience segments. Within the shifted emotions, 52% (7.8%) switched from Fan to Risk, and 48% from Risk to Fan. This allows companies to understand how to adapt their app to shift more Risks to Fans.

Mobile adoption accelerated in 2022, with consumers spending 3% more time on their devices daily and new app downloads increasing by 11%. (Finley, February 2023)

Mobile shopping hit an all-time high on Black Friday 2022—accounting for nearly 50% of all sales among the top 100 internet retailers in the US. In 2023, dollars spent in retail apps are predicted to migrate to experiences, including in the travel, events, sports, and health app categories. (FashionUnited December 2022)

For brick-and-mortar businesses, apps that communicate between the mobile consumer and in-store experience - effectively closing the communication loop – will keep inventory full while reducing the burden on employees. (McKinsey, January 2023)

Companies that don’t close the loop increase their churn by a minimum of 2.1% every year. Companies that do close the loop decrease their churn by a minimum of 2.3% per year. And customers are 21% more likely to answer the next in-app survey if you close the loop. (Customer Gauge, 2023)

Nearly 90% of VoC and CX measurement programs use email surveys to collect customer feedback. Yet 61% of respondents said their companies do not have a formal process for closing the customer feedback loop. (Forrester, 2022).
Across the mobile marketplace, 30-day retention rates are rapidly declining. The average mobile app saw a 30-day retention rate between 4-10% in 2022 (Appsflyer and Statista, 2022), down from 15-20% in 2021 (Appsflyer and Statista, 2021). There are a few factors at play, including changes to consumer privacy regulation, economic instability, and an ever-expanding marketplace of apps.
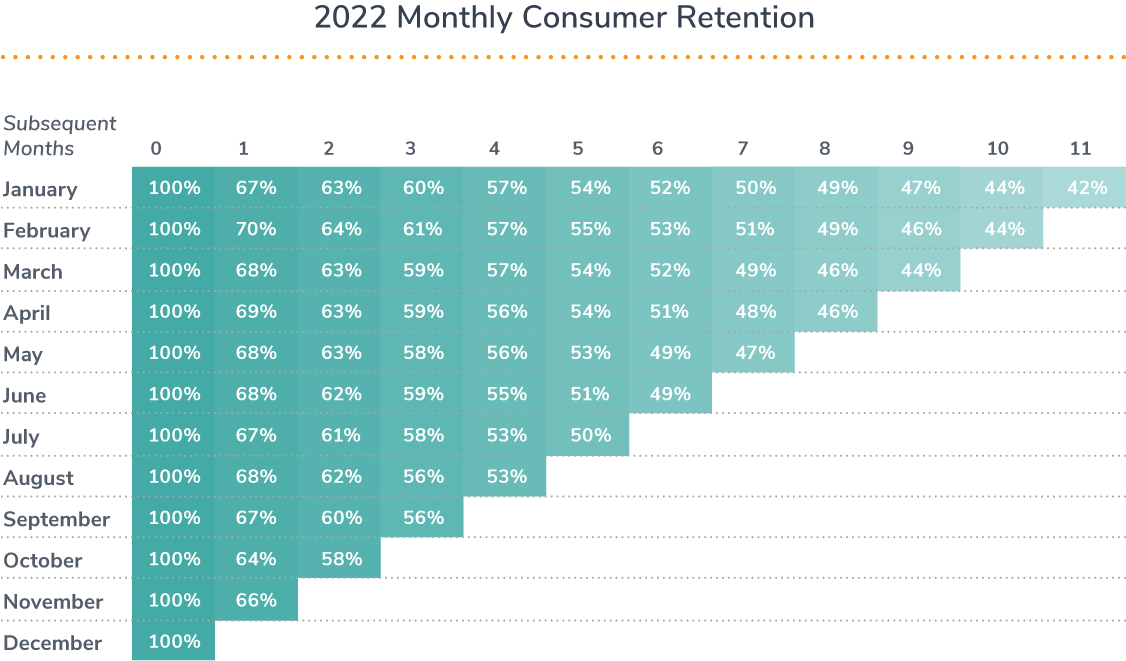
 However, 30-day retention did not decline for Alchemer Mobile customers, who saw an average 30-day retention rate of 67%—seven times the industry standard, driven by proactive consumer engagement.
90-day retention for the average mobile app falls between 20-30% (Appsflyer 2021). Alchemer Mobile data shows an average 90-day retention rate of 58%—twice the industry average. If consumers engaged with a Love Dialog in the first 90 days, their average retention rate went up to 63%.
Annual retention is generally not reported due to the acceptance of high consumer churn, but many companies who have shifted their strategies away from acquisition toward retention have begun benchmarking annually. Across all apps in our dataset, 42% of consumers who used the app in January 2022 were seen in December 2022. If the consumers saw an Alchemer Mobile interaction in January, 60% were still seen in December—an improvement of 43% just from mobile teams being proactive about gathering consumer feedback.