When we talk to prospective customers—whether they’re running CX programs, managing support teams, or looking for faster ways to understand what’s happening across the business—one message always comes through loud and clear:
Drowning in data but starving for insights.
That gap between data collection and decision-making is where the real friction lives. It’s the point where too many teams lose time, confidence, and the opportunity to act. And it’s exactly the gap we designed Alchemer Dashboard to close.
What Alchemer Dashboard Does
Alchemer Dashboard is the modern way to see what’s really happening in your organization.
Traditional reporting tools often rely on static snapshots or manual exports. They show what happened – but not what’s shifting, emerging, or in need of immediate attention.
Alchemer Dashboard changes that by delivering:
- Real-time, dynamic views of your data
- A living picture of customer and employee experience
- Continuous insight instead of one-off reports
This gives organizations a living, breathing understanding of:
- Shifts in sentiment
- Operational health
- Performance trends
- Customer journey patterns
- Program-level progress
Built for modern teams running CX programs
Teams need the ability to understand what’s happening—and why—without wrestling with complicated tools. They need clarity, context, and confidence.
Alchemer Dashboard is designed to be intuitive for every user, regardless of technical background. Visualizations are easy to build, customize, and share. Data flows in automatically. Insights update continuously. And dashboards are tailored to every role across the business, from frontline support agents to executive leaders.
By connecting feedback with broader business data—CRM systems, support platforms, digital channels—you finally get a complete, connected picture of your customer and employee experience.
How does Alchemer Dashboard help you move faster?
1. Always-on, real-time visualizations
With insights that refresh automatically, teams can react as trends shift, sentiment changes, or new patterns emerge. This makes it easier to:
- Monitor KPIs in real time
- Spot evolving issues
- Communicate insights to stakeholders
- Track performance across programs and channels
Real-time visibility means you’re never operating from outdated information.
2. Ease of use + deep connectivity
Dashboard is built so anyone can create insightful dashboards—without complexity, without coding, and without relying on analysts. And because it integrates with core business systems, it becomes the single place where teams can see:
- Cross-channel feedback
- Customer journey data
- KPIs aligned across teams
- Combined operational and survey insights
This unified view helps organizations break down silos and make decisions grounded in the full context.
3. Search-driven analytics & AI-powered insight
Alchemer’s AI is purpose-built specifically for CX and EX data, not adapted from generic, open-ended language models. That means it’s trained to understand feedback data, sentiment, operational metrics, and experience signals in context—so the insights it delivers are relevant, accurate, and actionable.
Just as importantly, all of this happens within a controlled, compliant environment. Your customer data stays protected—never exposed to external models—so teams can trust the insights they’re acting on.
Learn more about Alchemer Dashboard in our recent webinar, “Advanced Dashboard: Purpose-built AI tools that makes your job easier“.
Spark (AI Natural Language Model)
Ask a plain-language question, “What’s driving our decline in satisfaction this month?”.
And Spark instantly surfaces clear, actionable answers. No complex filtering. No digging. Just answers.
AI Highlights (AI ML + Anomaly Detection)
AI Highlights automatically scans your data to identify unusual patterns, emerging issues, and meaningful shifts. It brings hidden insights to the surface, so you don’t have to search for them.
Together, these tools dramatically reduce the time it takes to understand what’s happening and help teams take action sooner.
Practical ways teams use Alchemer Dashboard
1. Create real-time operational dashboards
Track CSAT, NPS, FCR, response trends, or resolution metrics—then connect them with CRM or case data for deeper context.
2. Deliver the right insights to the right teams
Give each department a dedicated view of what matters most:
- Product gets feature feedback.
- Support gets satisfaction trends.
- Executives get high-level visibility.
3. Identify trends before they become issues
Use AI Highlights to uncover performance changes or shifts in sentiment early—before customers feel the impact.
4. Speed up reporting & analysis with Spark
Ask questions and instantly surface answers—perfect for executive updates, performance reviews, and weekly summaries.
5. Tell clear, compelling stories with data
Combine visualizations across workflows and systems to build dashboards that communicate progress, challenges, and opportunities with clarity.
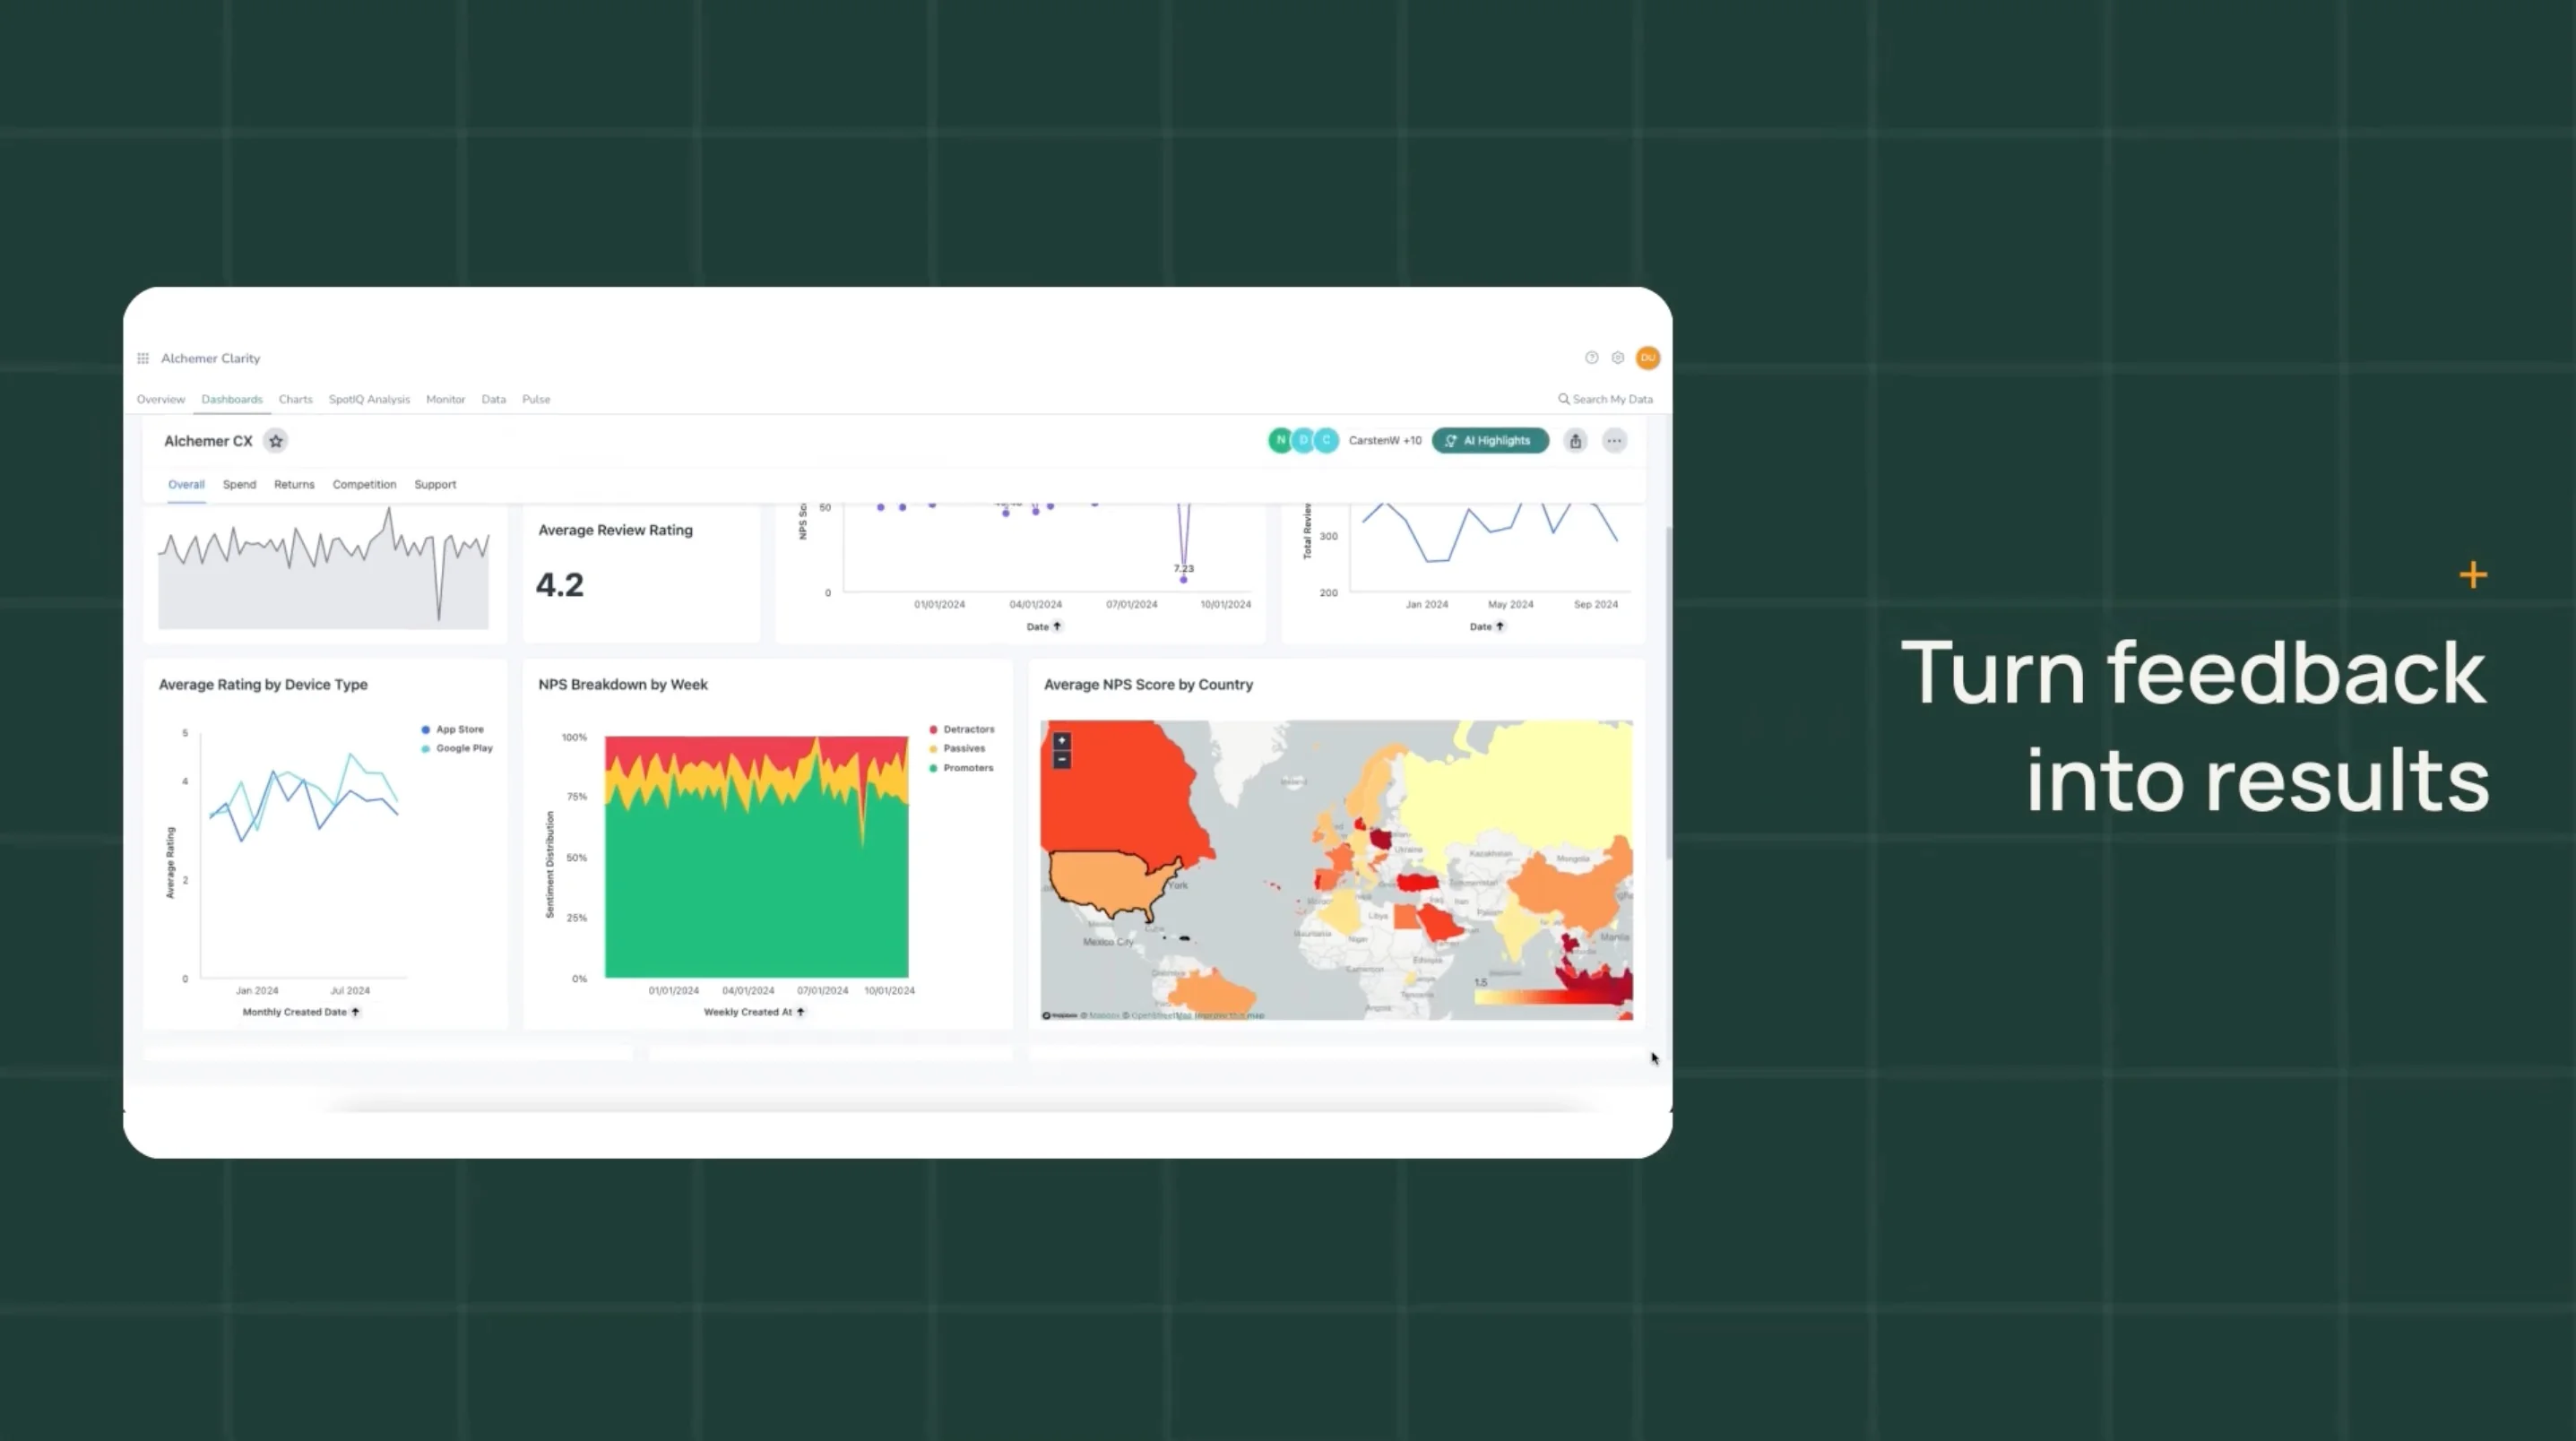
Turn feedback into action
Ready to turn feedback into action—without the spreadsheets, delays, or guesswork? Alchemer Dashboard gives every team a real-time, AI-powered view of what’s happening and why, so you can spot shifts early, share insight fast, and make decisions with confidence.
See Alchemer Dashboard in action and discover how quickly your data can start telling a clearer story.