Every higher education leader is being asked to do the same job with fewer resources....
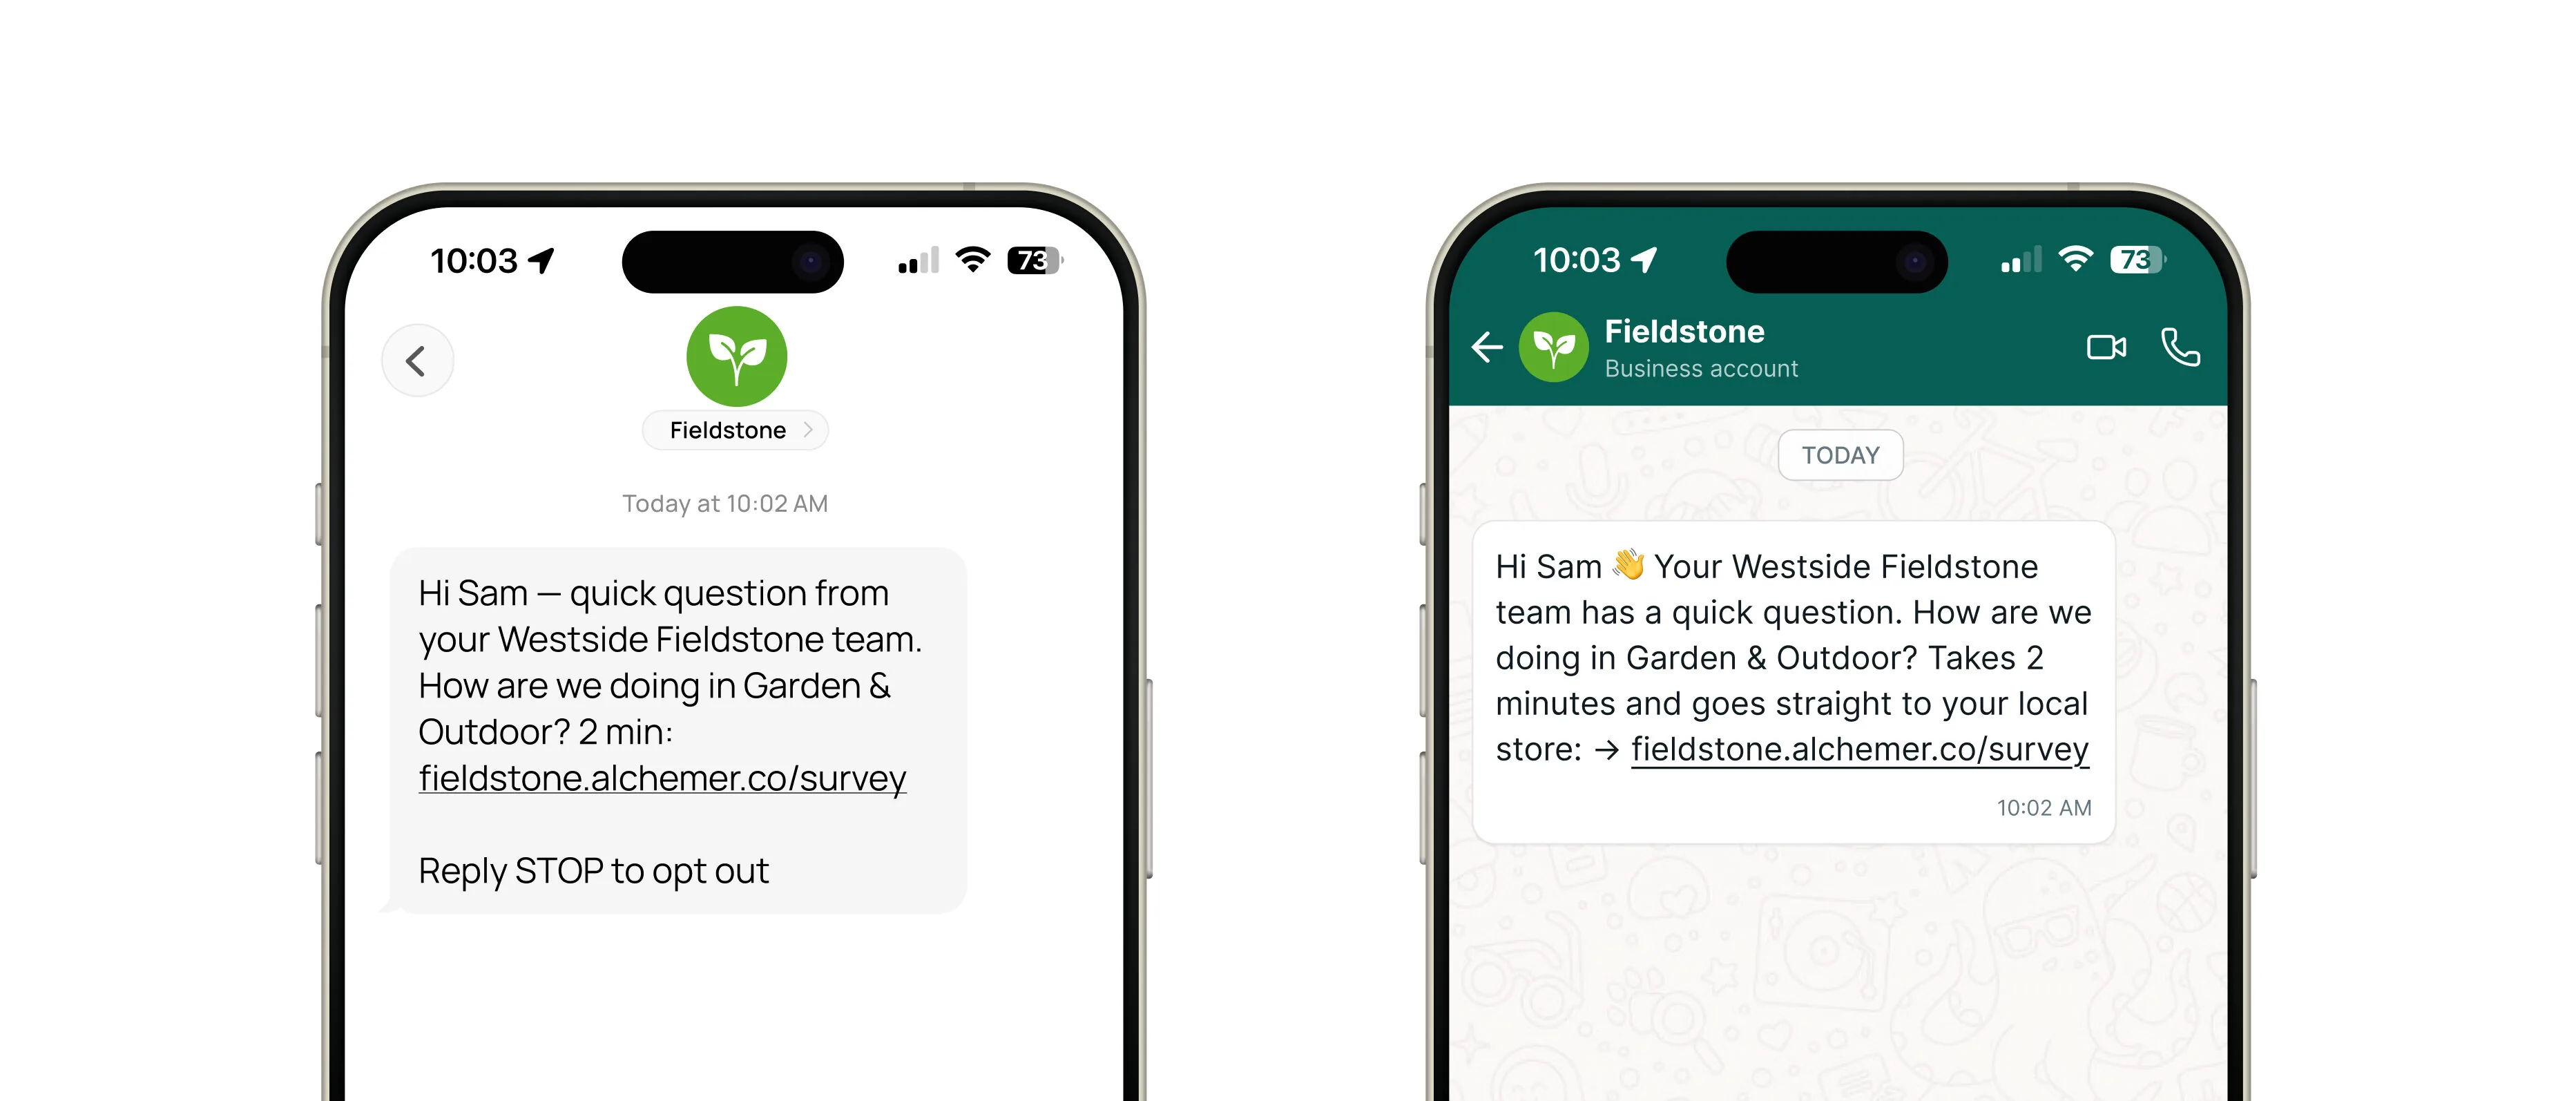
Email has been the standard way to invite customers to surveys for years. It works—but it’s no...
Some work doesn’t need a human, but it still has to get done. Responding to every review....
If you run a multi-location brand and you’re shopping for new reputation management software, you’ve...
The hardest part of working with feedback usually isn’t finding an answer. Pull up any dashboard and you’ll find a dozen....
You can set the brand standards, write the standard operating procedure (SOP), and design the...
Two hundred open-text responses are readable. You can sit down, work through them, and come...
Inappropriate reviews aren’t rare. Google removed 292 million reviews for policy violations in 2025, up from 240...
By accessing and using this page, you agree to the Terms of Use . Your information will never be shared.