Fan Signals®

Bar chart titled Fan Signals showing data from September 11 to October 5. The chart has bars in two colors, with a pop-up for October 7: Shifted to Fan: 2,750 (74%) and Shifted to Risk: 1,230 (26%), Total: 3,980.

Fan Signals®

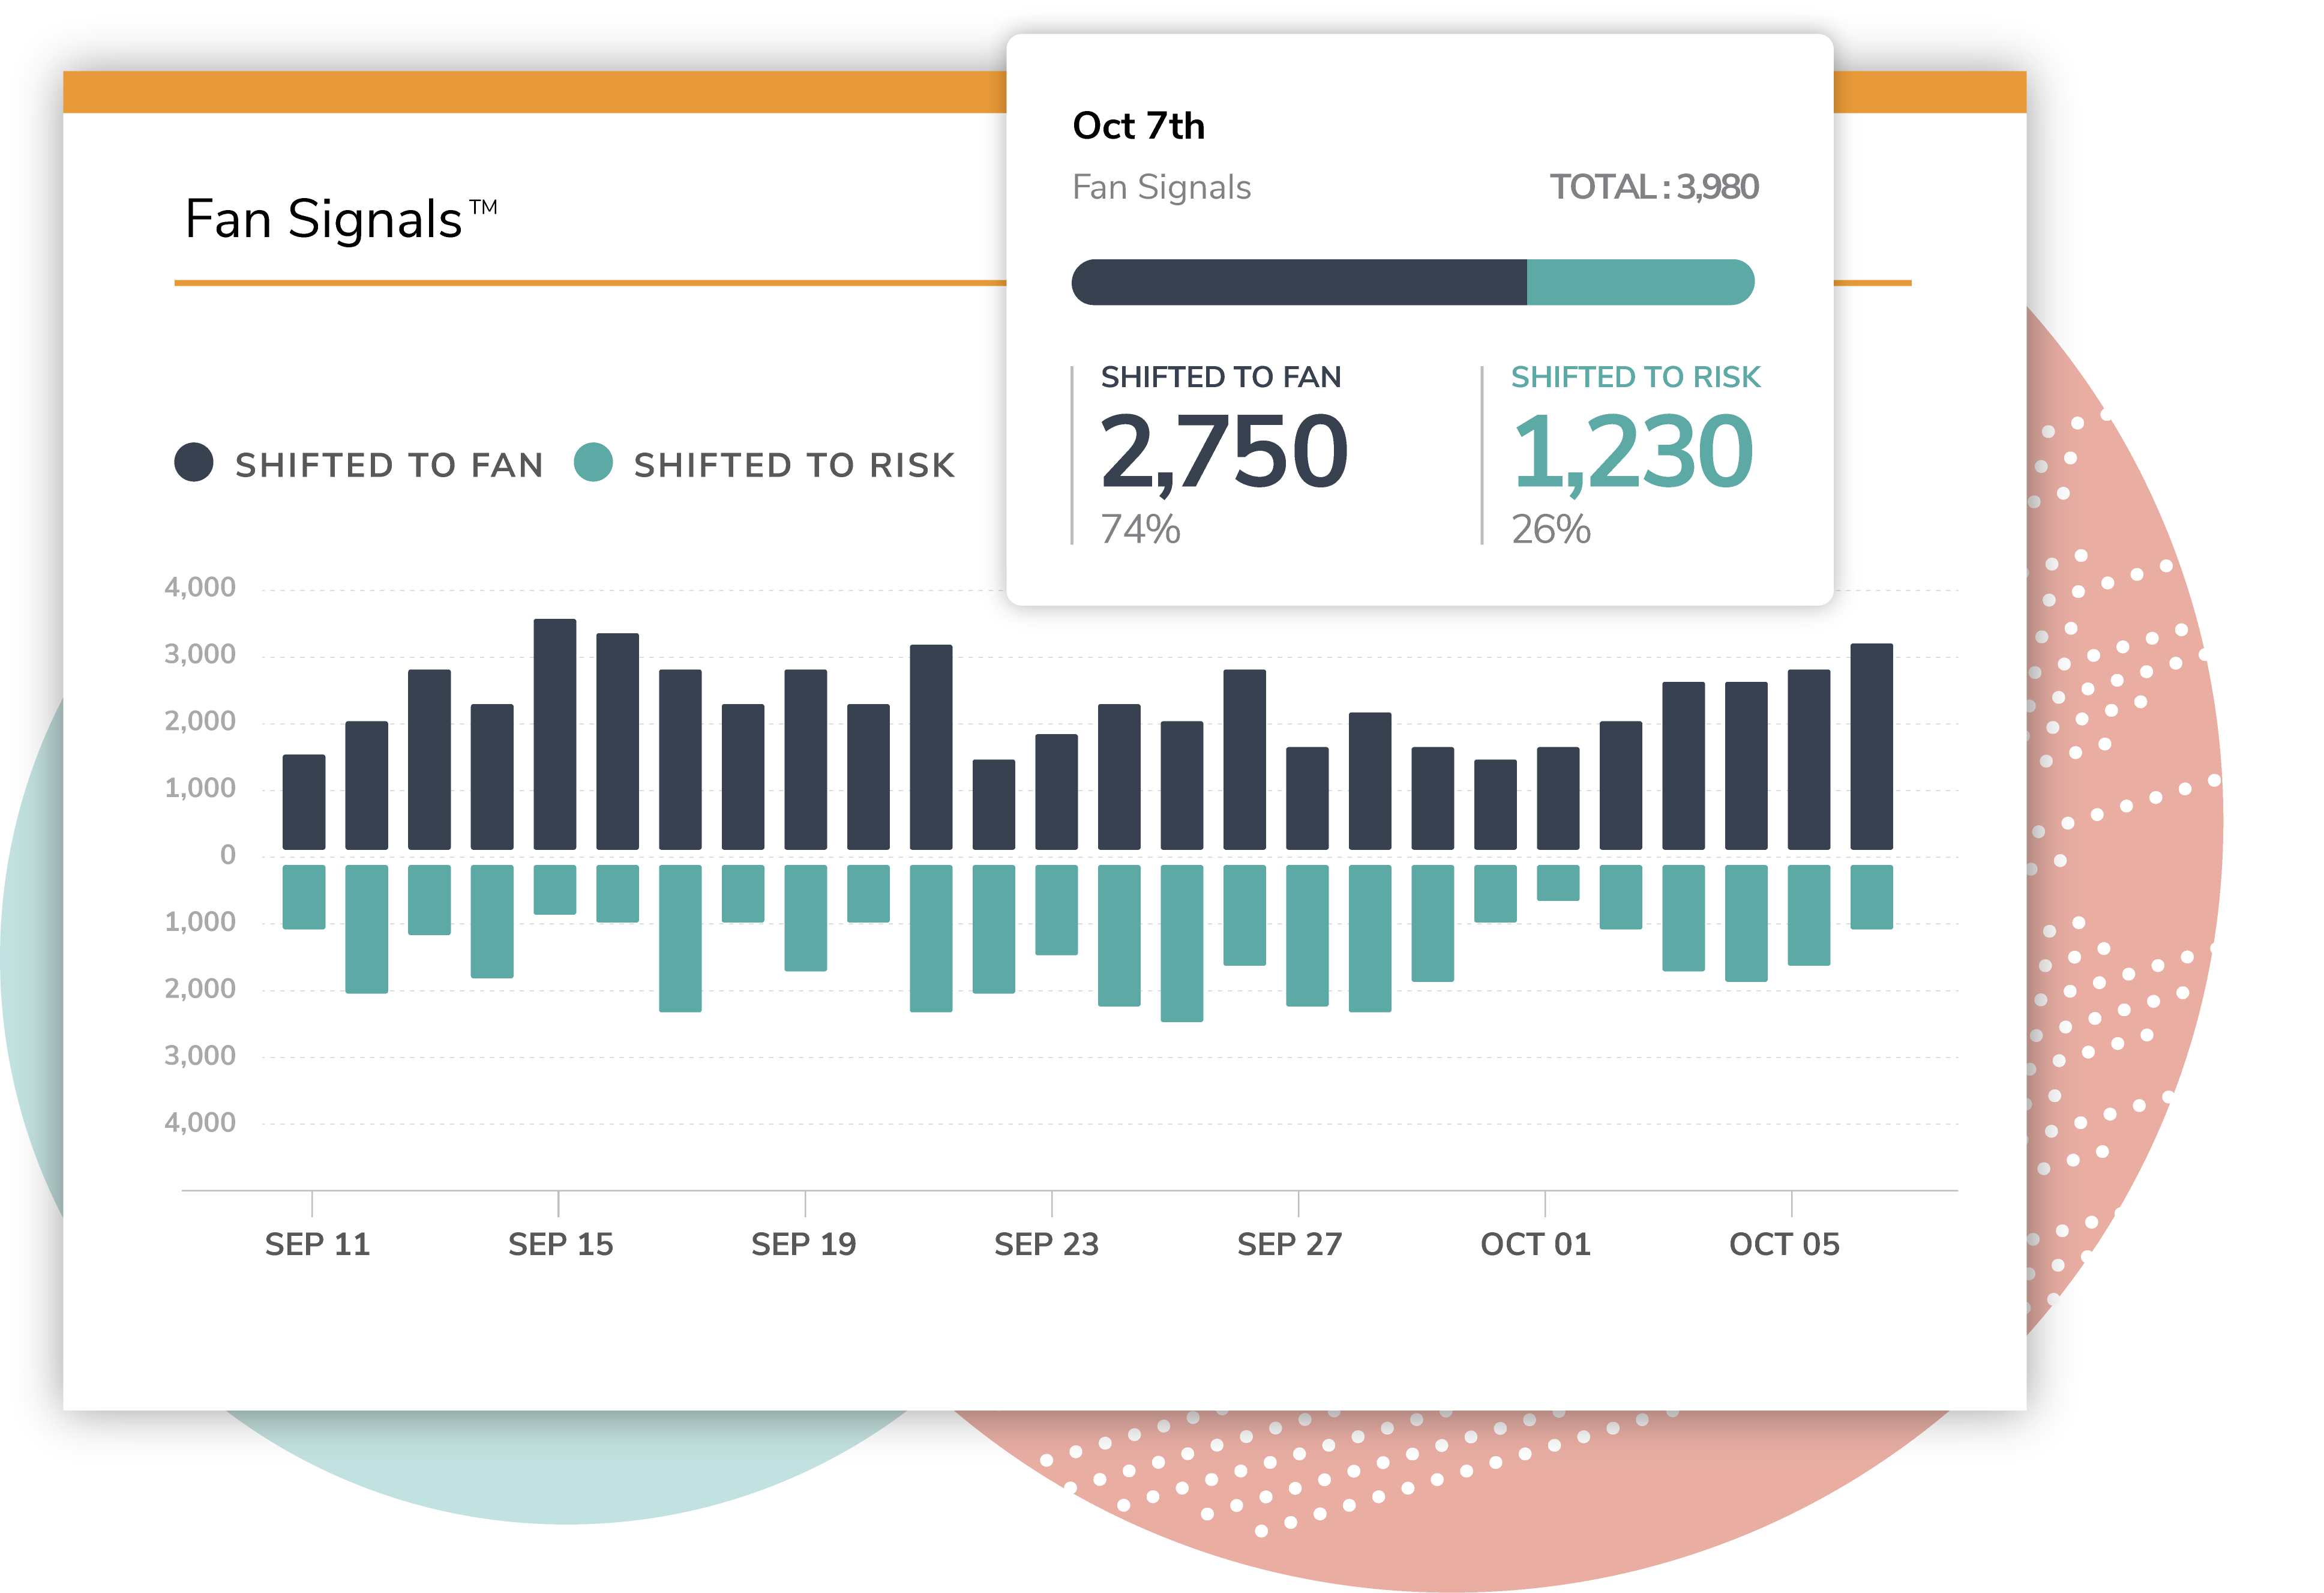
A collection of features that enable customer segmentation tied to categories of emotion. Fan Signals are derived from recurring Love Dialog® interactions, with customers being characterized as either Fan or Risk.

A person seated, holding a tablet displaying the 2023 Benchmark Report. The person is dressed casually in a patterned top and white pants, sitting in a relaxed posture with the focus on the tablet screen.

Request a Demo