What is Conjoint Analysis?
Conjoint analysis is a statistical method used to determine how customers value the various features that make up an individual product or service.
If performed correctly, conjoint analysis can reveal detailed insights into target markets and competitive landscapes, as well as help guide marketing strategies.
Due to its ability to provide powerful and actionable business insights, conjoint analysis has become one of the most widely-used quantitative methods in market research. Simply put, it’s a way to determine exactly what motivates people to choose one product over another.
Conjoint analysis can be used to measure preferences for specific product features, to gauge how changes in price affect demand, and to forecast the degree of acceptance of a product in a particular market.
But surveys built for conjoint analysis don’t typically ask respondents what they prefer in a product. Instead, respondents are asked to evaluate various potential product profiles. Each of these product profiles includes multiple product features that differentiate them from one another.
What is Choice-Based Conjoint Analysis?
While there are several different types of conjoint analysis, the most common variation used by researchers is choice-based conjoint, or CBC.
The reason CBC is so popular is that it mirrors real-world purchasing behavior. It presents combinations of attributes to respondents simultaneously and asks them to identify which they prefer. This accurately simulates how respondents actually view the products that comprise a market in their day-to-day lives.
The great thing about conjoint analysis is that researchers don’t need to ask each individual respondent to rank every single combination of attributes and levels to calculate what their overall preferences are. By using mathematical analysis, respondents’ answers to questions they were never even presented can be inferred based on the answers to questions that they were presented.
While evaluating survey data, individual answers from respondents are combined, or conjoined, in order to come up with ultimate rankings of the products or services being investigated.
For more information on the precise mathematical formulae that provide these outputs, be sure to check out our detailed documentation.
When to Run a Conjoint Analysis
Before you even get started administering a survey for conjoint analysis, you’ll want to make sure you’ve got a strong need for the insights that it will provide.
Running a conjoint analysis is fairly labor intensive, but the benefits outweigh the investment of resources if it’s performed correctly.
With some products, consumers’ purchasing decisions are based on emotion. In these cases, conjoint analysis probably won’t yield actionable insights.
However, if your product offers a concrete feature set that is likely to be compared with those of your competitors, then conjoint is a great choice.
The insights yielded from conjoint analysis can inform decision-making in the following areas of business:
- Product Development & Improvement
- Pricing
- Competitive Positioning
- Resource Allocation
- Segmentation
Further, if you’re aiming to answer the following questions, you should consider running a conjoint study.
- How should we price our latest product so that we maximize adoption in the marketplace?
- What features could we include in the next release that will allow us to take market share from our competition?
- If we expand our product line, will overall revenue grow?
- Which value-add features is the market willing to pay for?
How To Build a Conjoint Analysis Survey in Alchemer
Conjoint analysis in general and CBC, in particular, are enormously powerful tools for researchers trying to determine their next moves in a competitive market. But, it’s essential to set up your conjoint analysis surveys correctly in order to receive the most impactful and actionable data possible.
Below we’ll walk through exactly how to build a conjoint analysis survey in Alchemer.
As an example, let’s say we’re researching which attributes are most influential when a consumer is purchasing a TV. We have the below attributes and attribute levels to consider:
- Brand: Edge, TVC, Yanso
- Screen Size: 36″, 40″, 48″, 56″, 60″, 75″
- Refresh Rate: 60hz, 120hz, 240hz
- Price: $499, $529, $799, $899, $1099, $1499
- HDMI Ports: 1, 2, 3, or 4 ports
- Wi-Fi: Wi-Fi Enabled, No Wi-Fi
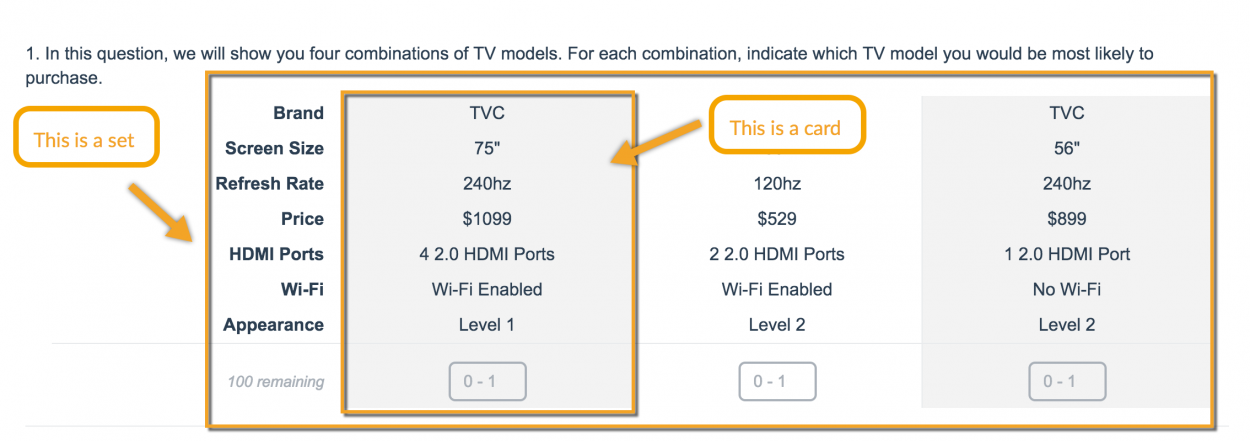
Using the choice-based conjoint question in Alchemer, we can show combinations (aka cards) of potential attribute levels to respondents to analyze how they make choices between these products.
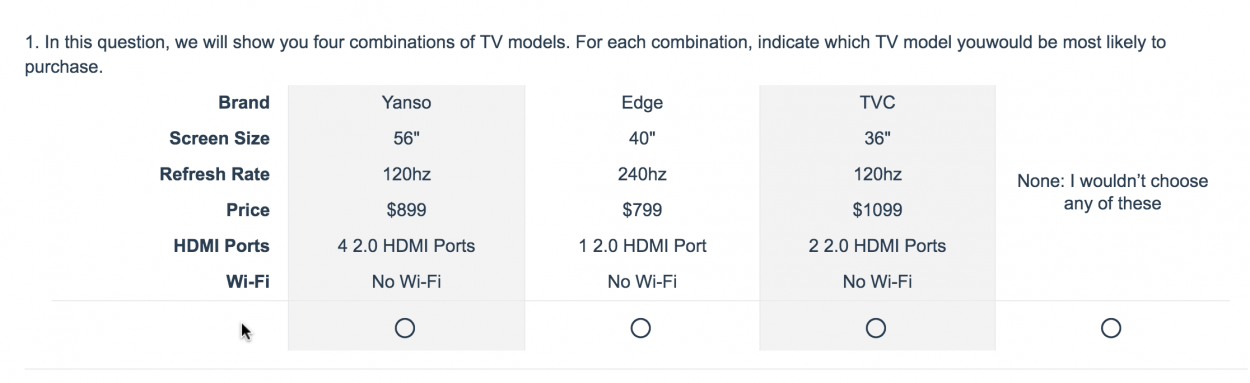
The resulting conjoint question will look like the example below. In this example, we present respondents four sets of three cards, as well as a none option. For each set, respondents can make a single selection.
Step #1: Add a Conjoint Question to your survey.
Click Question on the page where you wish to add your conjoint question. Your conjoint question should be on a page by itself.
Next, select Conjoint (Choice Based) from the Question Type dropdown and add your question text. Your question text will depend on the Choice Type.You are going to need to provide instructions for the respondent as to how to respond to the question text or the question instructions field.
Step #2: Add your Attributes and Attribute Levels.
Skip down to the Attribute Setup and begin adding your Attributes and their Levels.
- Attributes are the characteristics of a product (e.g. color, price, etc.). An Attribute is made up of various Levels (e.g. silver, black red). In our example, they are Brand, Screen Size, Refresh Rate, Price, HDMI Ports, and Wi-Fi. We recommend displaying no more than six attributes in your conjoint question; any more and respondents will have difficulty weighing options and might resort to simplification strategies, such as ignoring one attribute altogether.
- Levels are the various values of an attribute. So for example, for Price we’ll add the following values: $499, $529, $799, $899, $1099, and $1499. The conjoint question requires, at a minimum, two levels.
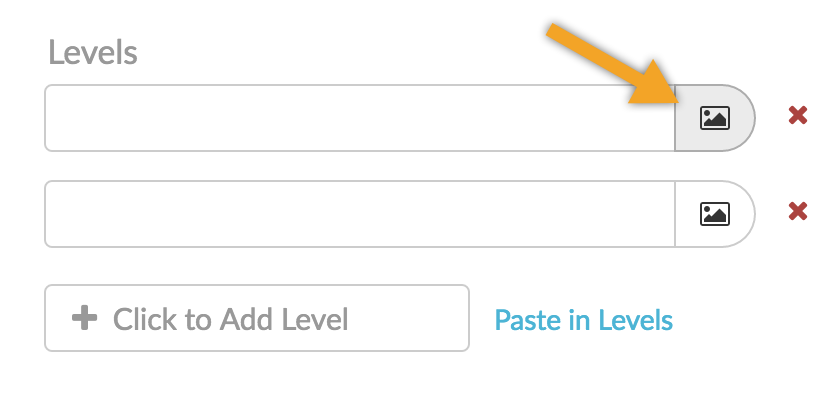
If you have an image you wish to display, click the image icon to the far right and select an image from your File Library or upload an image.
Step #3: Select your Choice Type.
Once you have all of your Attributes and Levels set up, scroll back up to the Format options. For Choice Type, you have four options.
A) Single Choice with None
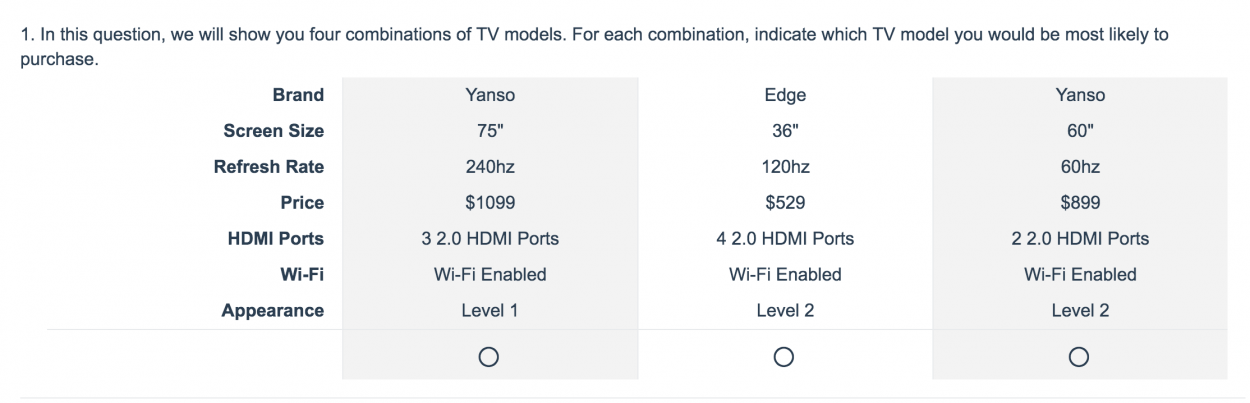
“Single Choice With None” provides a radio button for each combination, as well as a none option. Respondents can select a single radio button for each set.
B) Single Choice
“Single Choice” provides a radio button for each combination from which respondents can select a single preferred combination.
C) Best vs. Worst
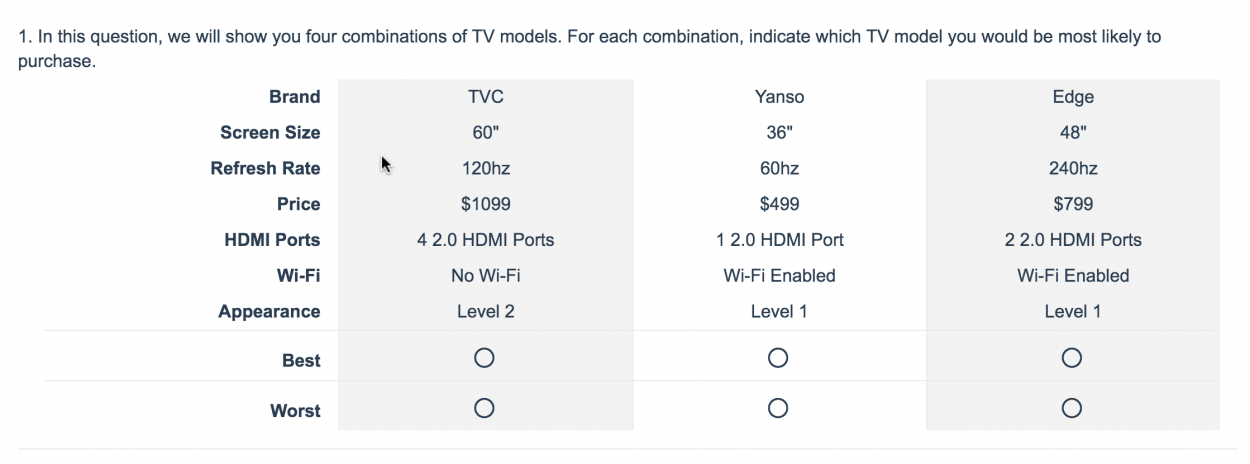
“Best vs. Worst” provides a best and worst radio button for each combination. Respondents can select a best and worst combination for each set.
D) Continuous Sum
“Continuous Sum” provides text fields in which respondents can enter a numeric value for each that adds up to a total that you specify. This method is often referred to as chip allocation; the idea being that you can ask respondents to indicate, of the combinations in each set, how many of their next ten purchases would be of each combination.
This doesn’t make sense for our TV example because consumers typically purchase one TV at a time. Instead, the Continuous Sum Choice type makes the most sense for something like packaged products, say, for example, breakfast cereals.
If you are using the Continuous Sum Choice Type, it is best to provide instructions for the respondent as to how to respond to the question text or the question instructions field.
Step #4: Select your number of Cards per Set.
Select the Number of Cards per Set to display to each respondent, as well as the Number of Sets Shown to Each Respondent.
Step #5: Prohibit particular level pairs.
By default, all Attribute Levels have an equal likelihood of displaying together. What this means is that some product combinations that will display in your conjoint question are not realistic. For example, sometimes a product will be shown with all the best features and at the lowest price.
The inclination to prohibit such combination is a common one. You can do so on the Logic tab, however, we discourage the use of prohibited pairs and if you do use them, use them sparingly. Why? Learn more.
Think about the conjoint question like a set of index cards containing all possible combinations. The index cards are randomized. From this randomized list of cards, a number of cards are selected creating a unique set. For the next set, a number of cards are selected from the same randomized list making sure that the same combination is never displayed more than once to a respondent.
Step #6: Distribute your survey.
Send your survey to an existing list of potential consumers, or leverage our panel services to identify a list of survey respondents for you.
Step #7: Report on your survey results.
There are two elements included in the Standard Report for the conjoint question.
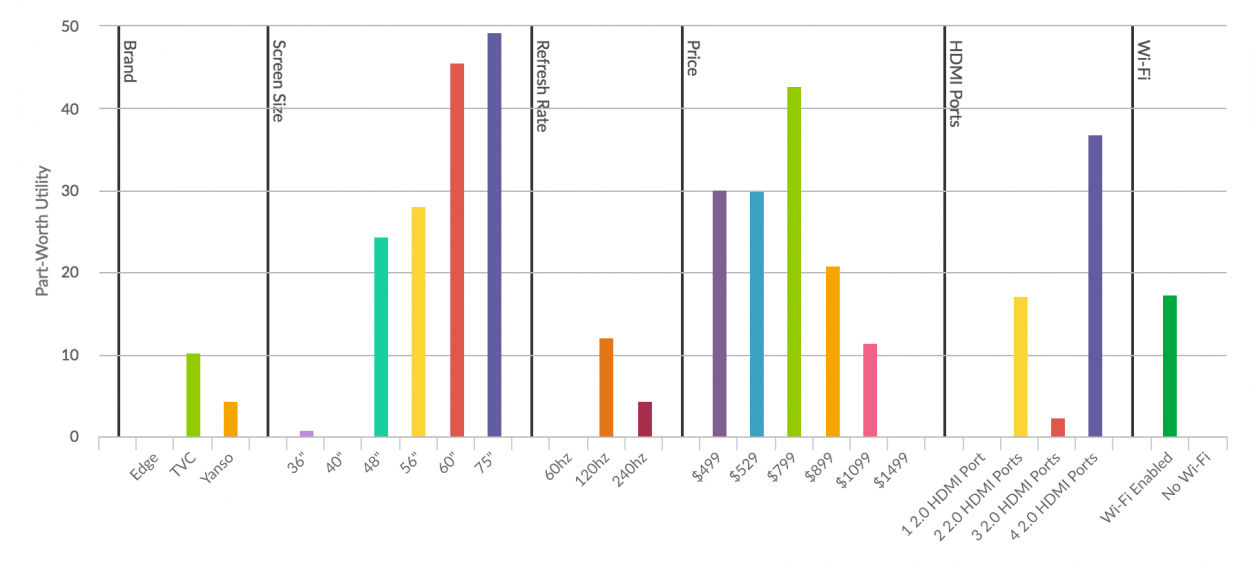
The Part-Worth Utilities bar chart shows the importance of individual attribute levels based on their part-worth utilities. A utility is a measure of relative desirability or worth. The higher the utility, the more desirable the attribute level. Levels that have high utilities have a large positive impact on influencing respondents to choose products.
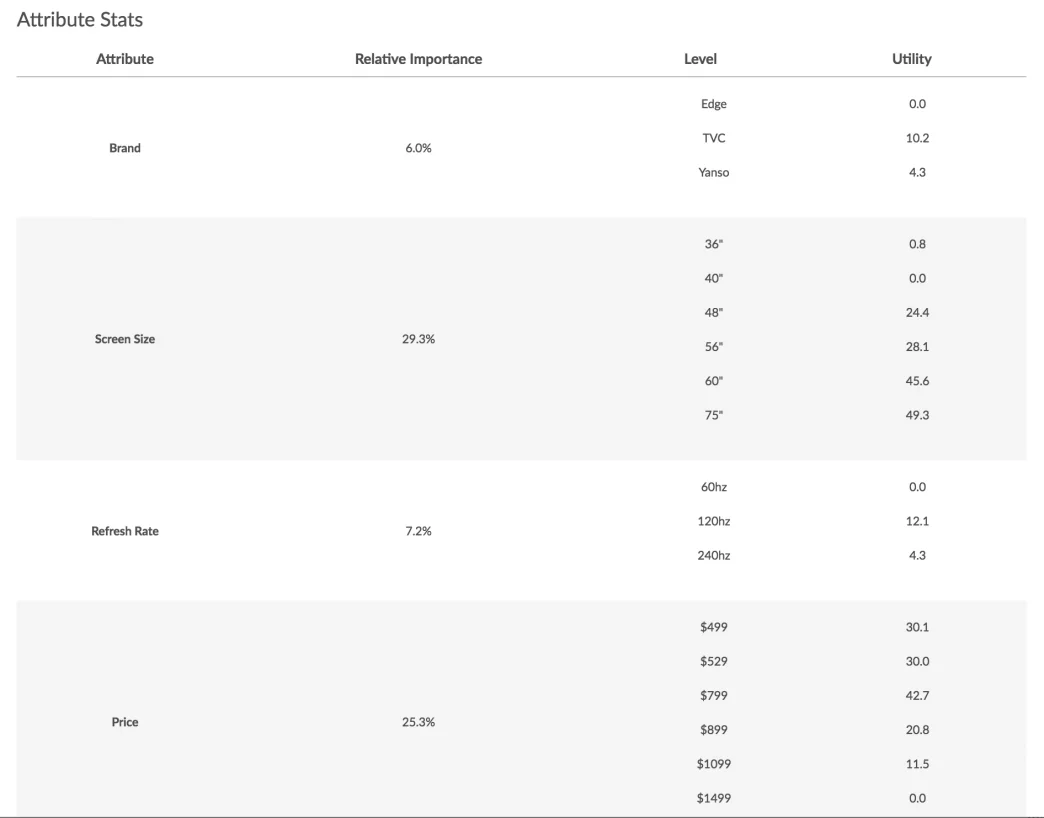
Below the part-worth utilities bar chart is an Attribute stats table for all Attributes and their Levels. Each Level will have a Utility. Each Attribute will have a Relative Importance percentage. All Relative Importance percentages will add up to 100 percent. Think of Relative Importance as the influence the attribute has on product decision-making.
Step #8: Export your results.
Raw data exports for the conjoint question are found under Results > Exports.

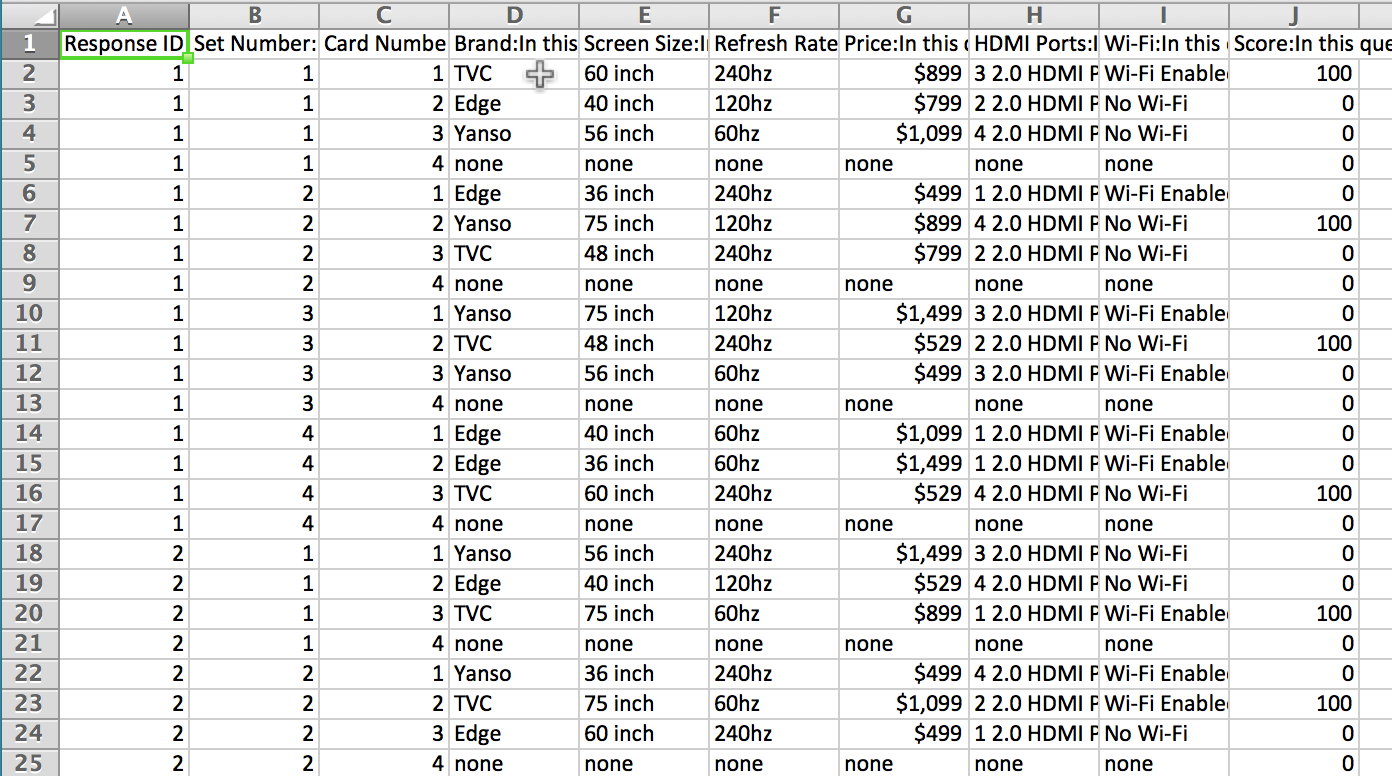
The export will include a row per card displayed to each respondent. As you can see below, Response ID 1 takes up rows two through 13. The first row is “Set 1 Card 1” that was displayed to this respondent.
For each card, the levels of each attribute that were displayed to the respondent are included in columns D through G. The final column displays the score this card was assigned. Learn more about how cards are scored.
If you wish to run your own analysis to compute your own part-worth utilities and importance, this is the file you will need to do so.
Step #9: Create a market simulator.
One of the most useful ways to present conjoint data is a market simulator, which turns the difficult-to-interpret part-worth utilities into an easy-to-understand, decision-making tool. By using a market simulator you can determine if a new combination of product attributes would do well compared to current products on the market.
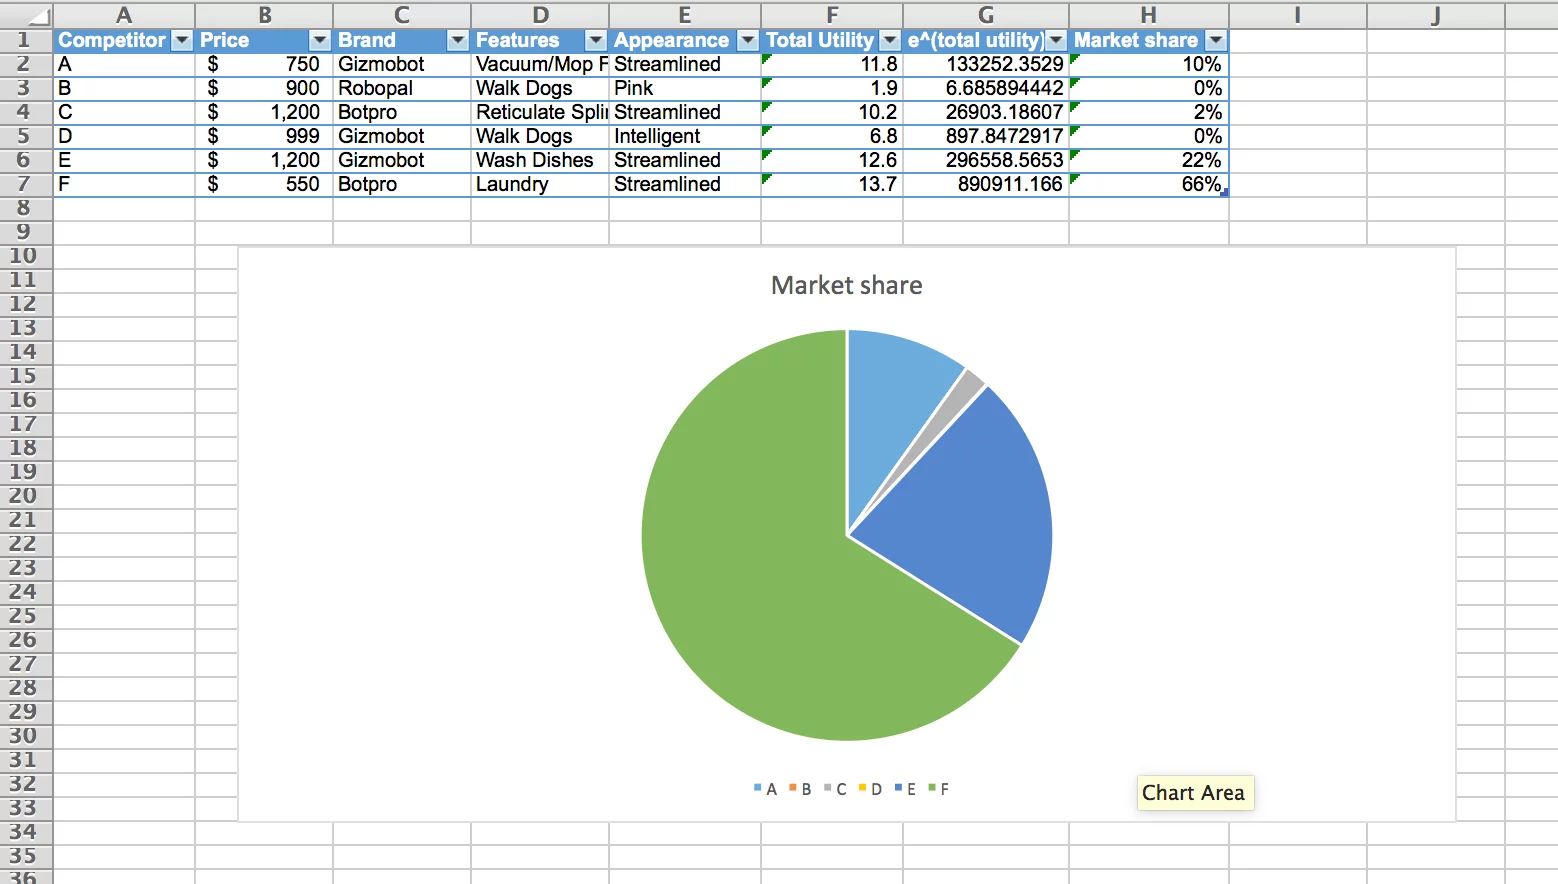
Below is the market simulator we created for a conjoint question about robots. From the below market simulation, we can conclude a number of things.
Let’s imagine Gizmobot and Robopal are the existing robot brands. Botpro is a new brand who ran this conjoint survey to understand what robot attributes will do well in the market.
In the below market simulation, we’re simulating the two Botpro models (C and F) against the market leaders. By toggling the various attribute levels we determined that a Streamlined Botpro robot that does laundry offered at $550 will have a 66 percent share of the market!
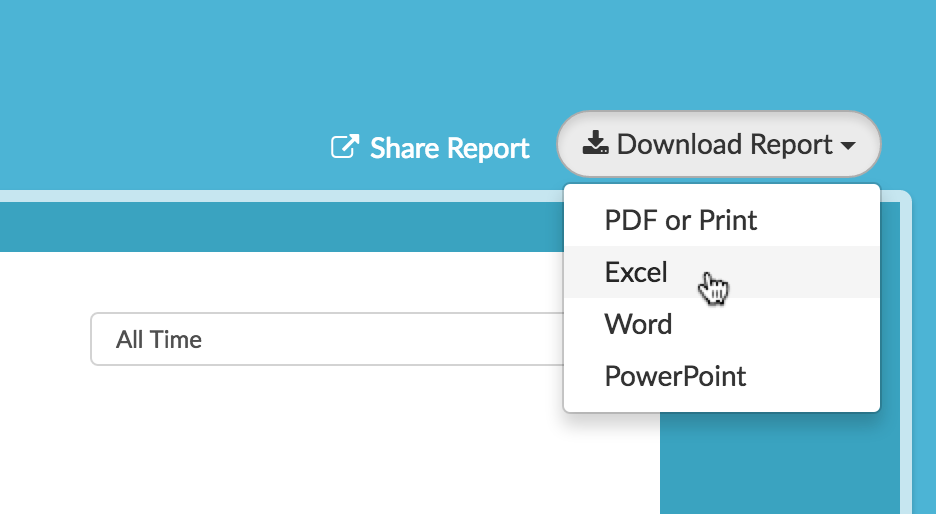
First, export your Conjoint Standard Report Data to Excel. To do so, create or edit your Standard Report. Click the Download Report option in the upper-right corner and select Excel.
Then, download our example market simulator here.
Next, paste your exported data on the Export from Alchemer tab.
Copy and paste your Attribute Stats from the exported data to the Utility Lookup tab.
Now you’re ready to start simulating! On the Market Simulator tab, you’ll notice the last three columns show as “not available”. This is because these columns are using the Excel VLOOKUP function and the data on your Utility Lookup tab does not yet correspond. As such, you’ll need to adjust the data on the Market Simulator tab to correspond with your data.
Start by editing the column headers to reflect your attributes. If you have more than four attributes you’ll need to add a new column for each additional attribute.
Now, you’re ready to start building out the combinations of attribute levels that you are interested in understanding. We recommend copying and pasting the attribute values from the Utility Lookup tab to the Market Simulator tab as the VLOOKUP requires an exact match to work. You can add rows and delete rows to simulate additional or fewer combinations.
Happy conjoining!
Have you used conjoint analysis to inform decision-making at your organization? If so, we’d love to hear from you! Drop us a note in the comments below.
